- Français
- English
- Español
- Italiano
- Français
- English
- Español
- Italiano
What does the VWRL ETF invest in?
The VWRL ETF stands for the FTSE all-world Exchange Traded Fund (*ETF). It is an investment fund that acquires securities with the intention of tracking the performance of the FTSE All-world Index.
*An ETF is an Exchange Traded Fund. They look to track the performance of a basket of assets, commodities or, in this case, an index. An ETF is traded like shares on a stock exchange. It is a pooled investment fund. Trading CFD ETFs through Pepperstone is a derivative of the underlying product.
The Objective
The VWRL fund seeks to provide long-term growth of capital by tracking the performance of the index, a market- capitalization weighted index of common stocks of large to mid-cap companies in developed and emerging countries.
Weighted investments
The top 5 holdings within the fund make up 11.83% of overall investments with over a 4% allocation in Apple Inc.
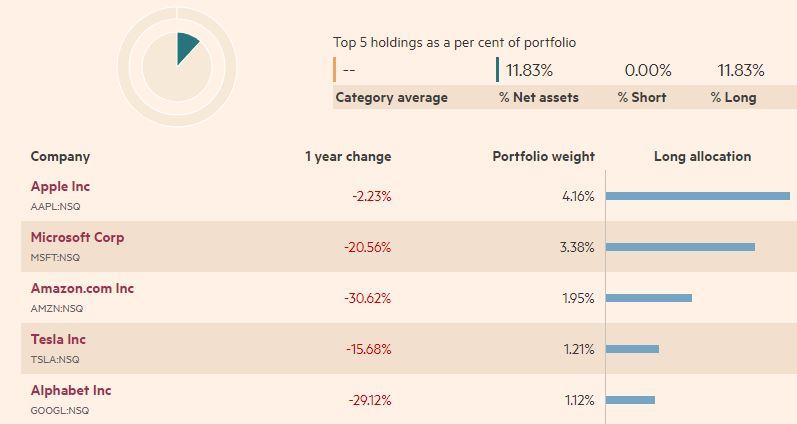
Figure 1 marekts.ft.com 10/10/2022
Invested Sectors
It is plain to see from the single stock allocation that the VWRL is weighted towards the technology sector.
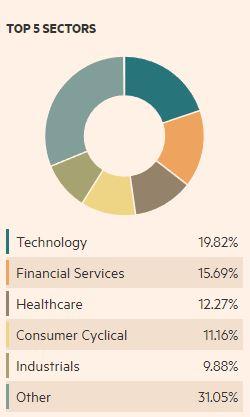
Figure 2 marekts.ft.com 10/10/2022
A look from a technical perspective
Historic price
Since its inception in May 2012, the VWRL ETF witnessed an increase of nearly 200% (from a 31.18 low to a 93.36 high).
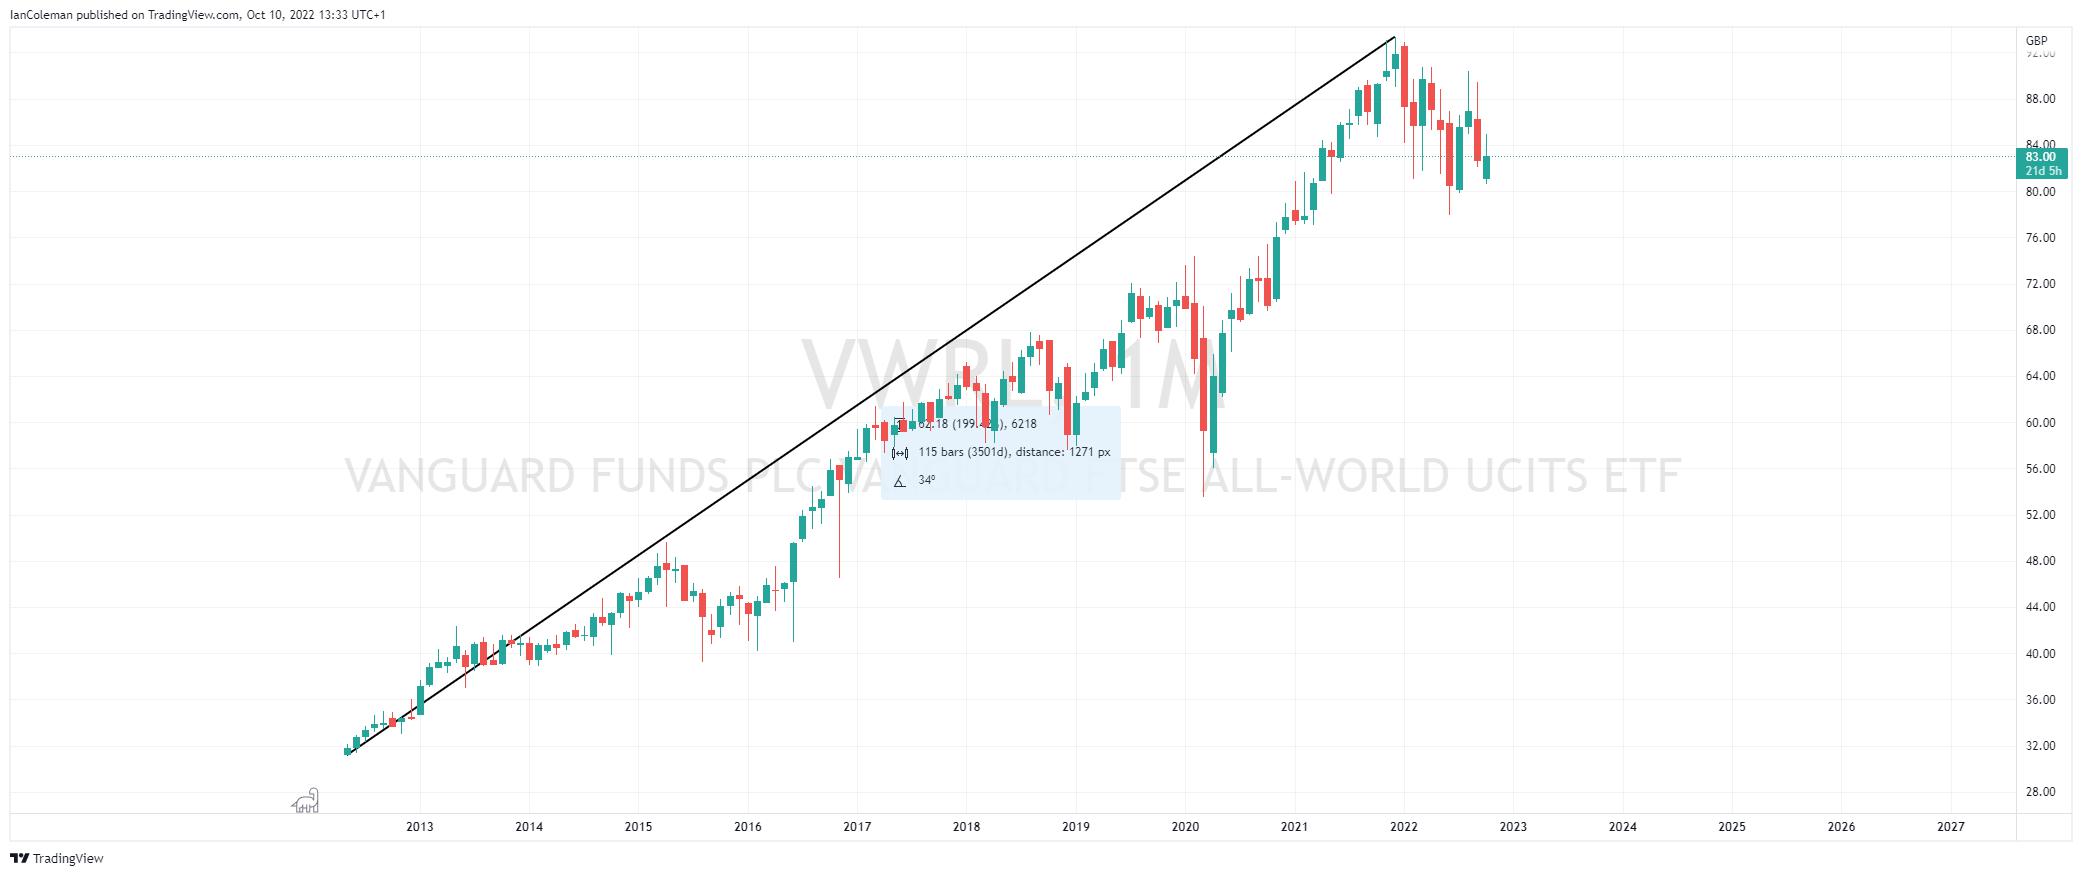
Figure 3 TradingView VWRL rally
Although we have seen a correction the downside, we are still holding within a bullish channel formation with trend line support located at 68.50.
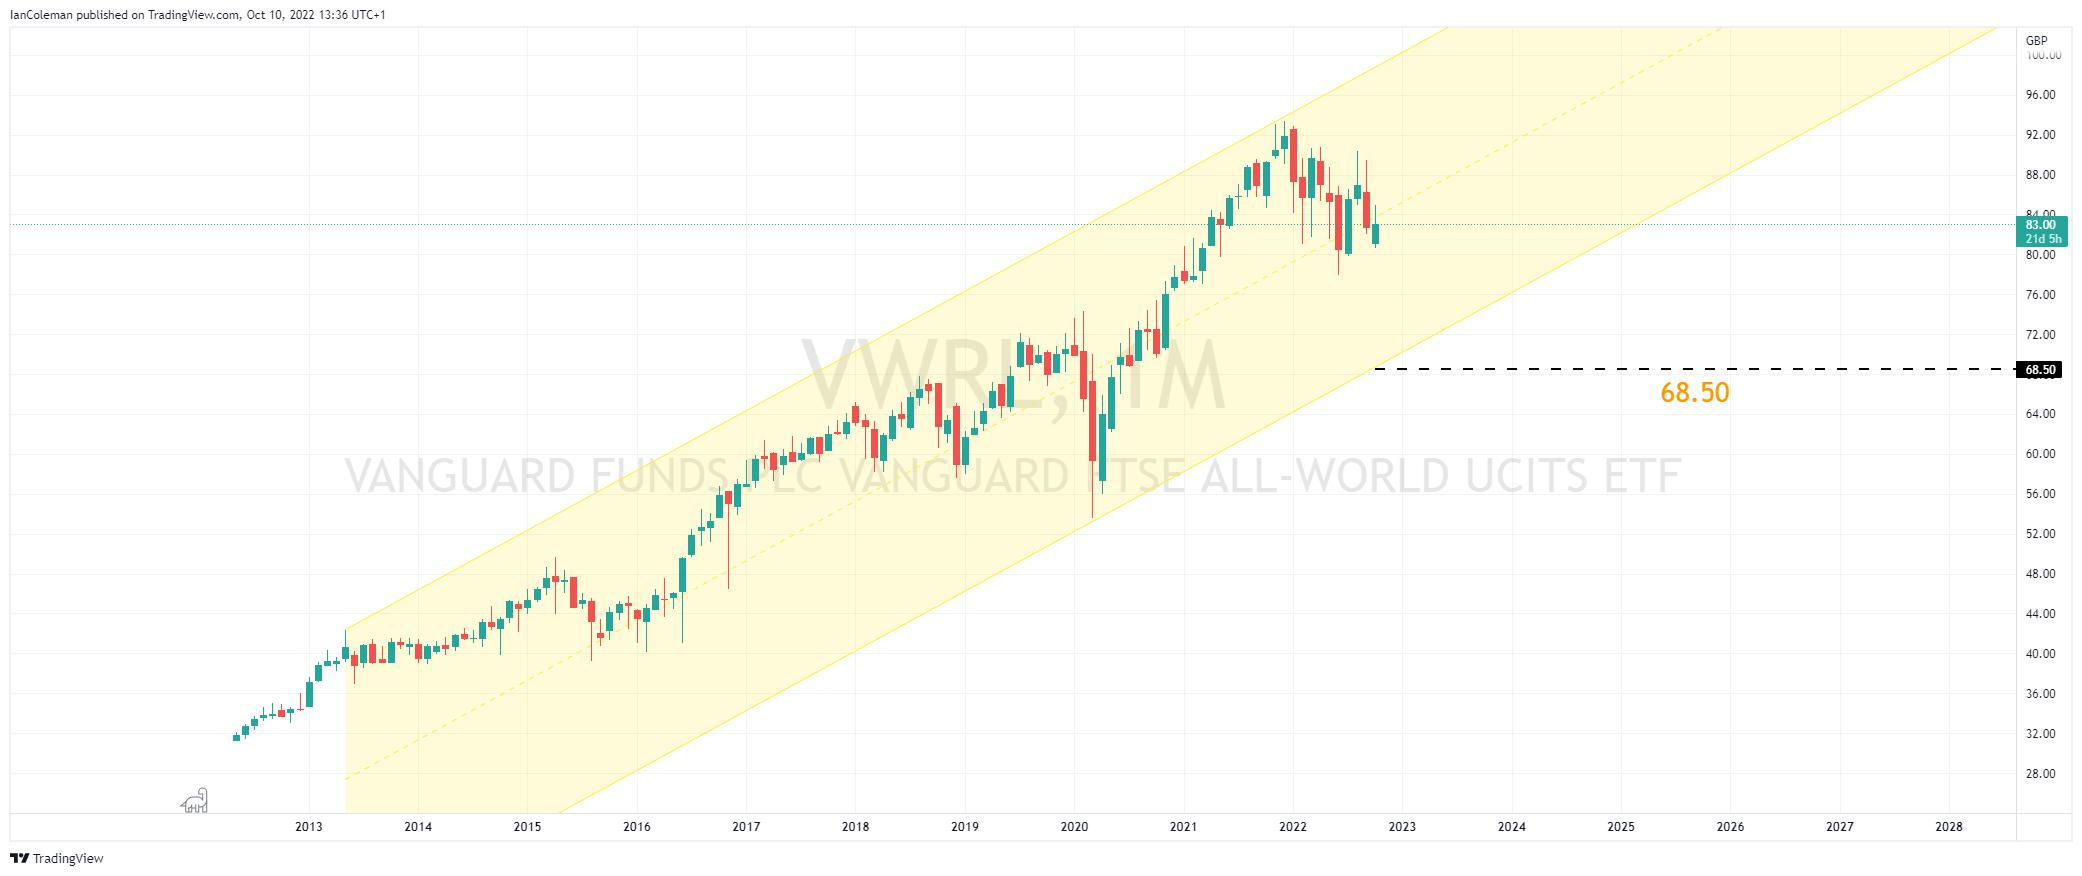
Figure 4 TradingView bullish channel
A look from a technical analysis perspective.
VWRL Weekly Chart
The weekly chart offers two possible bullish technical formations for the ETF:
- We look to be holding within an Expanding Wedge formation (dashed black lines). This pattern has an eventual bias to break to the upside.
- The last rally stalled close to the 78.6% Fibonacci level of 90.07 (from 93.36 to 77.90)
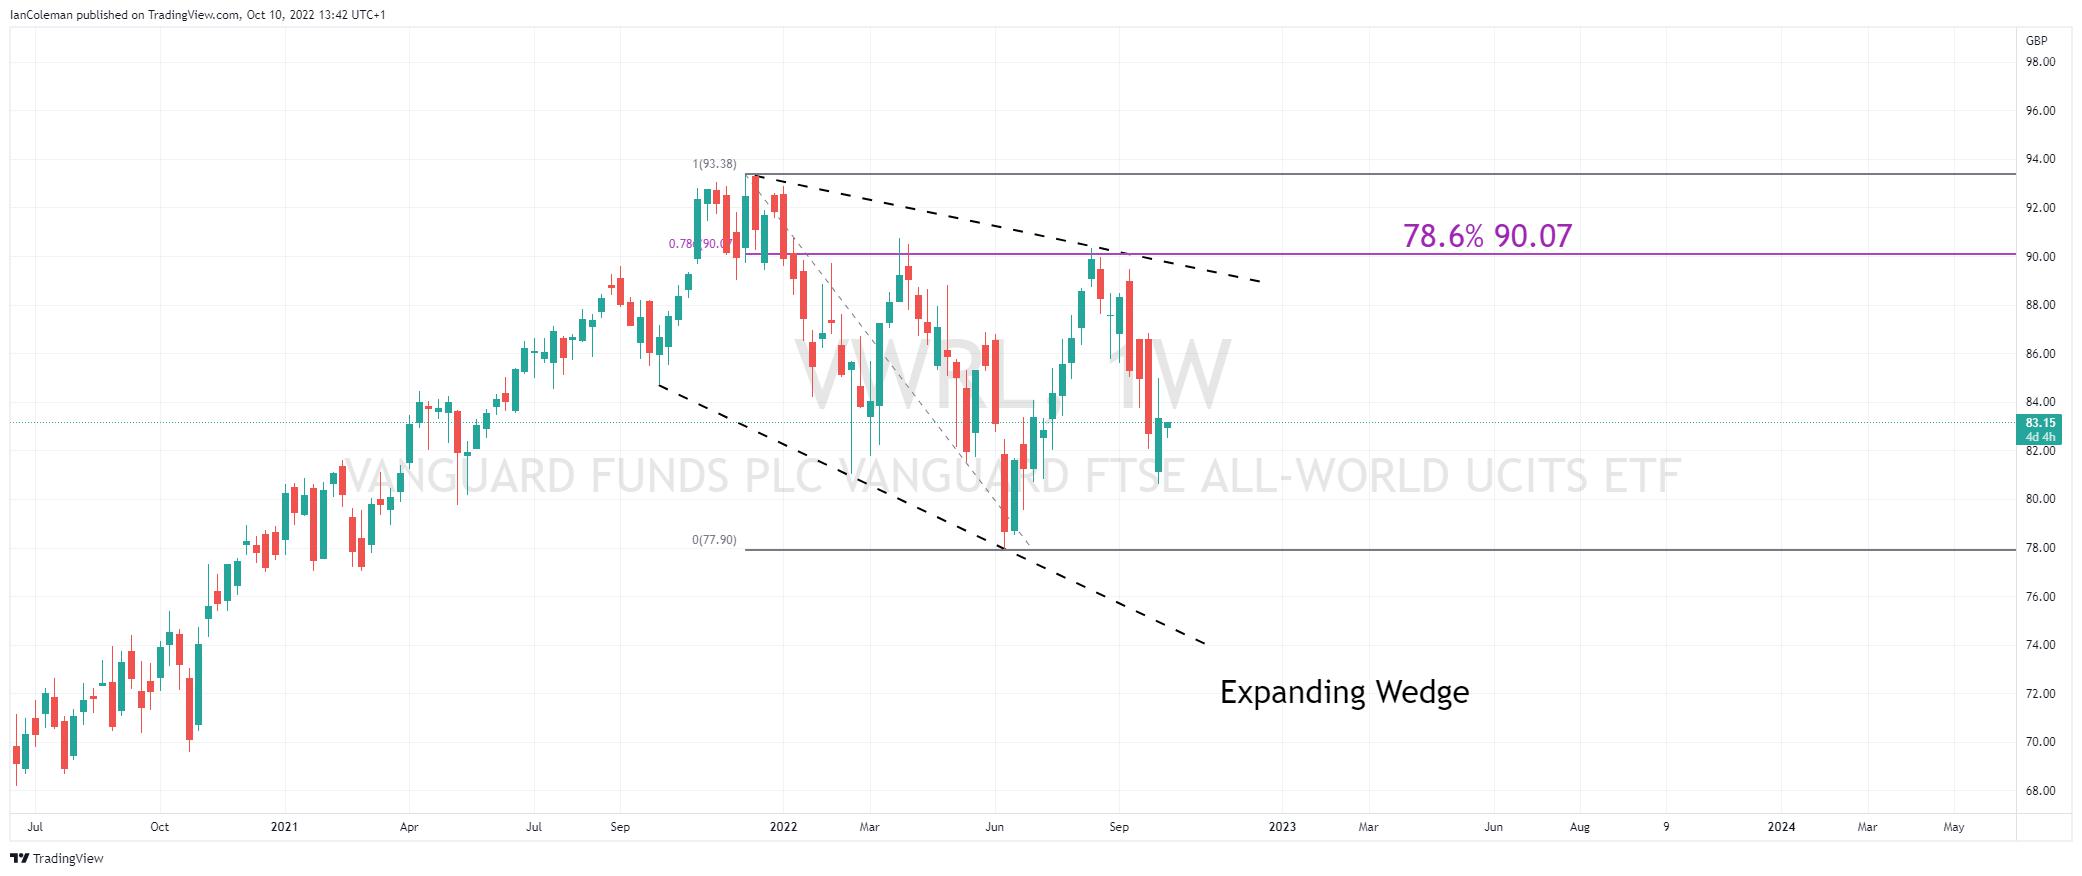
Figure 5 TradingView Expanding Wedge and 78.6%
If 77.90 holds (the swing low from the week 13th of June), we could see an extension to the upside to complete a Cypher pattern known as a bearish Butterfly formation.
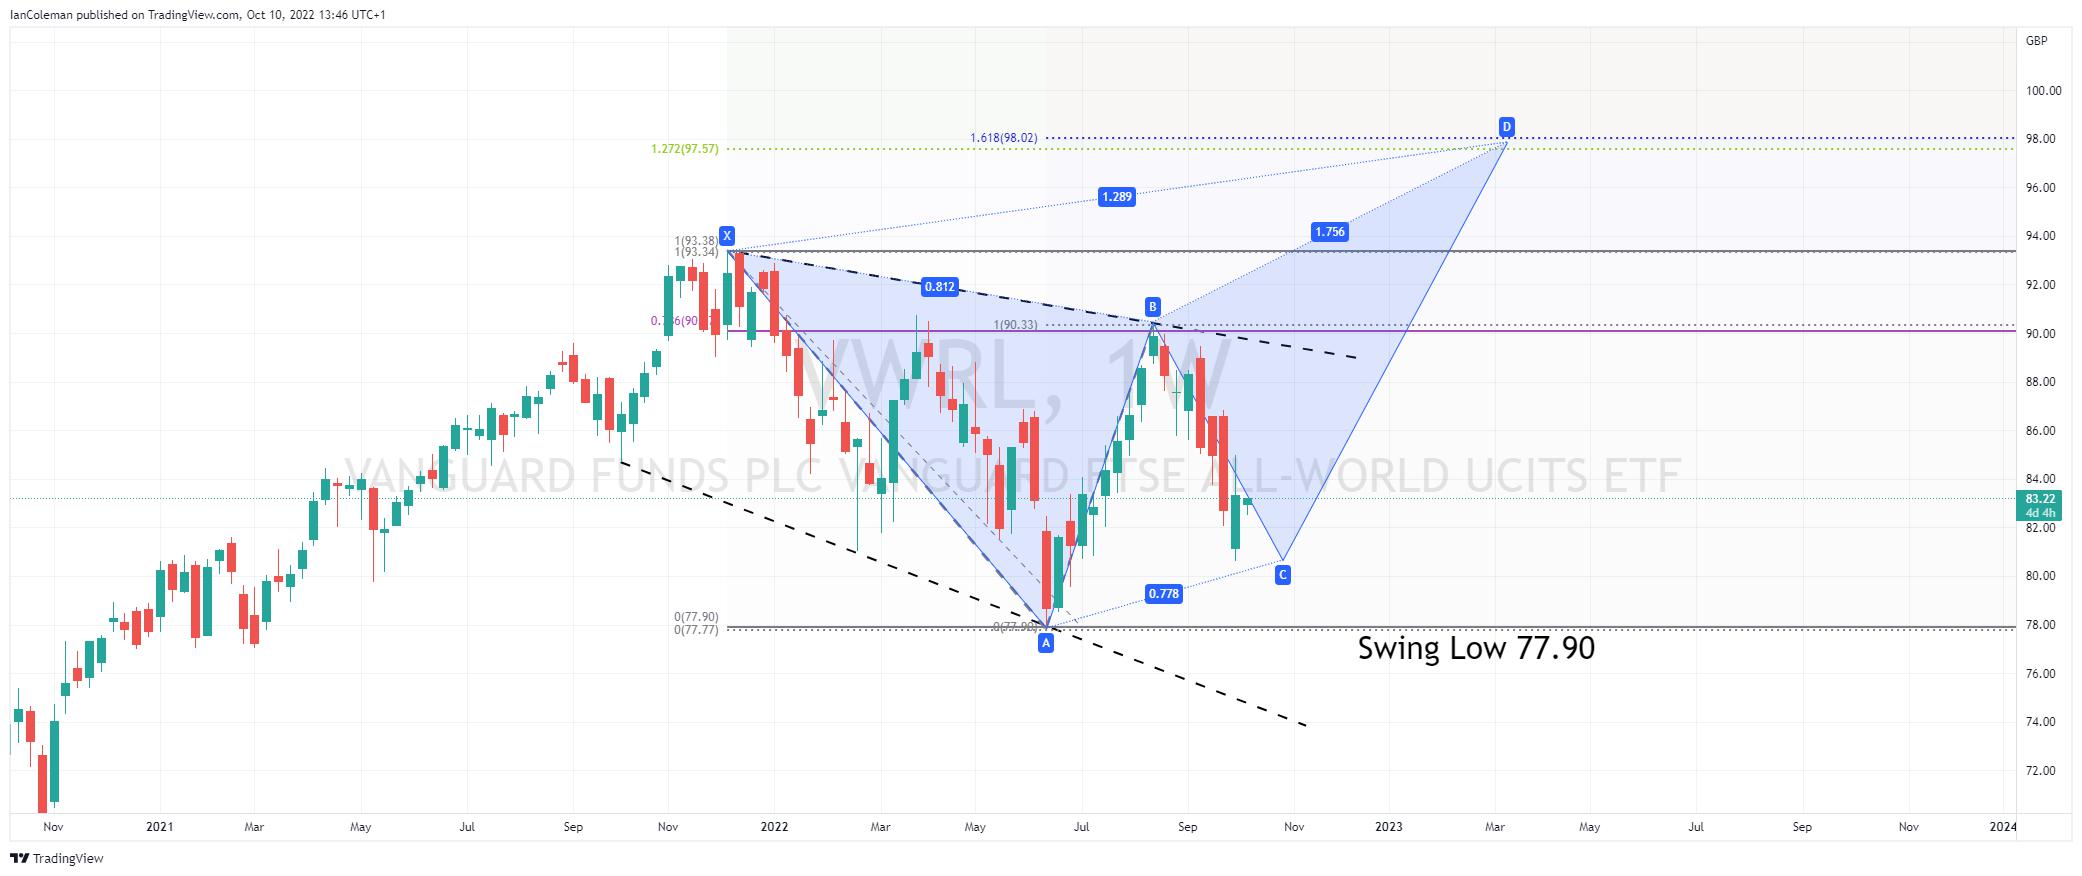
Figure 6 TradingView possible Butterfly pattern
To learn more about technical analysis, please click here.
Le matériel fourni ici n'a pas été préparé conformément aux exigences légales visant à promouvoir l'indépendance de la recherche en investissement et est donc considéré comme une communication marketing. Bien qu'il ne soit pas soumis à une interdiction de traiter avant la diffusion de la recherche en investissement, nous ne chercherons pas à tirer parti de cela avant de le fournir à nos clients. Pepperstone ne garantit pas que le matériel fourni ici est exact, actuel ou complet, et ne doit donc pas être utilisé comme tel. Les informations, qu'elles proviennent d'un tiers ou non, ne doivent pas être considérées comme une recommandation; ou une offre d'achat ou de vente; ou la sollicitation d'une offre d'achat ou de vente de toute sécurité, produit financier ou instrument; ou de participer à une stratégie de trading particulière. Cela ne tient pas compte de la situation financière des lecteurs ou de leurs objectifs d'investissement. Nous conseillons à tous les lecteurs de ce contenu de demander leur propre conseil. Sans l'approbation de Pepperstone, la reproduction ou la redistribution de ces informations n'est pas autorisée.