- Français
- English
- Español
- Italiano
- Français
- English
- Español
- Italiano
Analyse
March 2024 CPI Recap: Continued Lack Of Progress Pushes Cuts Back Further

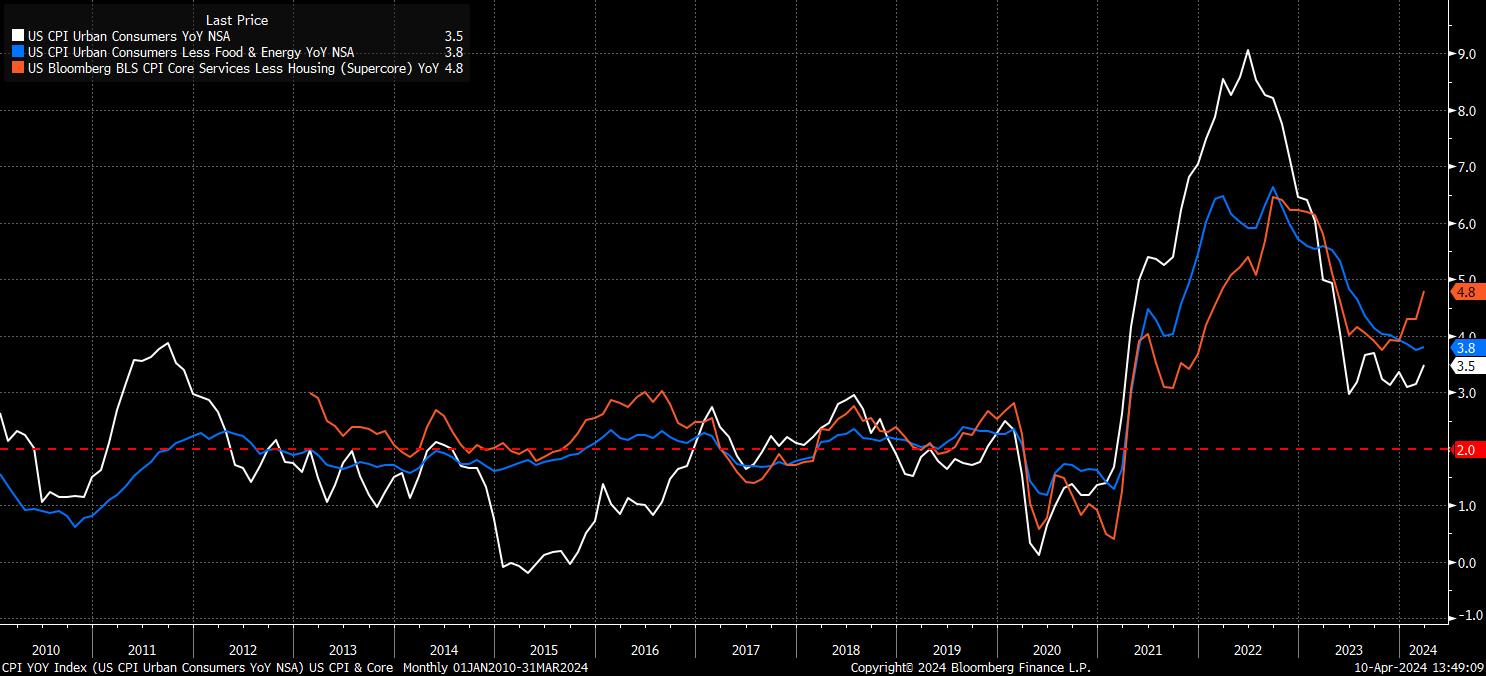
Headline CPI rose by 3.5% YoY in March, a significant uptick from the 3.2% YoY pace seen a month prior, and above consensus expectations of a 3.4% print – the 4th straight hotter than expected headline CPI print in a row. Core CPI, meanwhile, remained unchanged at 3.8% YoY last month, a worrying sign, which implies that disinflation progress within the US economy may be stalling, a particularly concerning sign for an FOMC who continue to seek additional “confidence” that inflation is on its way back towards the 2% target. Of even more concern, ‘supercore’ inflation (core services ex housing) rose to 4.8% YoY, its highest level in almost a year.
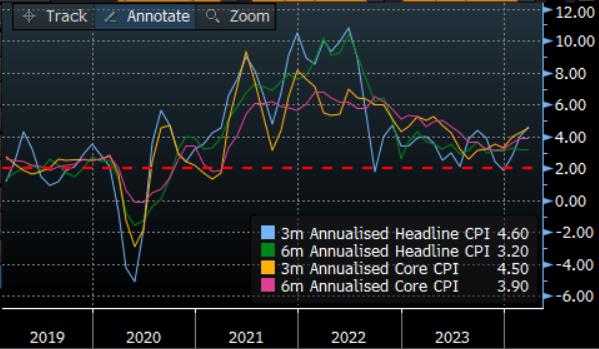
It is, however, important to note that the annual inflation metrics are not necessarily the most accurate way of interpreting incoming price data, while FOMC members also place increasing weight on 3- and 6-month annualised CPI metrics, though of course the PCE inflation gauge – due later this month – remains the primary focus.
These metrics, however, are similarly concerning. Headline CPI rose 0.4% MoM in March, unchanged from the month before, while core prices also rose 0.4%, also being unchanged from the pace seen in February. Clearly, this also points to a worrying lack of disinflationary progress. Converting these prints to annualised figures produces the following:
- 3-month annualised CPI: 4.6%
- 6-month annualised CPI: 3.2%
- 3-month annualised core CPI: 4.5%
- 6-month annualised core CPI: 3.9%
Naturally, this is easier to visualise via a chart, which helps to illustrate, yet again, the lack of progress that the economy appears to be making towards the FOMC’s target, with all of the aforementioned measures ticking higher compared to the prior month.
Digging further into the inflation figures, it’s clear that the uptick in headline inflation was driven primarily by a substantial rise in energy prices, particularly gasoline, as the component snapped a disinflationary streak that had previously run for at least the last 12 months. Nevertheless, price pressures remain relatively broad-based across the economy.
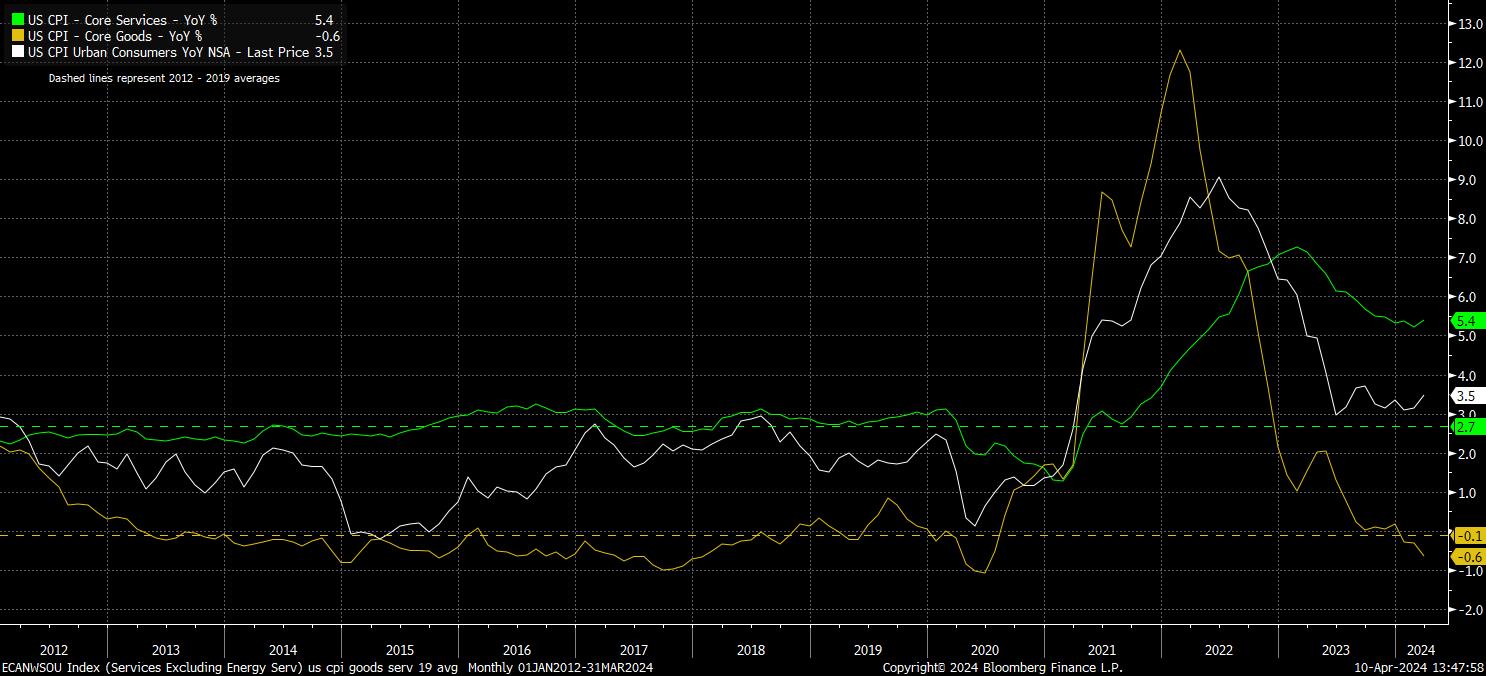
Sticking with inflation components, a clear divergence remains between core goods and core services prices. The former fell 0.6% on an annual basis in March, as the pace of goods disinflation quickened, and the component slipped further beneath the pre-pandemic average. In contrast, services prices remain stubbornly high, rising to 5.4% YoY last month, likely a direct consequence of the continued labour market tightness seen within the US economy.
While goods disinflation has continued, this divergence is of particular concern given the increasing upside risks to goods inflation, as geopolitical tensions persist, and transport costs rise, factors which may contribute to push headline inflation higher still, particularly if the pace of services disinflation remains painfully slow, or even prices begin to make a resurgence, as this report demonstrates is a distinct risk.
As always, however, some context is key with this inflation report, particularly in terms of potential policy implications. While the bumpy path back to the FOMC’s 2% inflation target continues to be followed, policymakers will be loath to over-react to a single print, particularly when there are another two CPI prints to come before the June FOMC, at which the sell-side consensus still sees the first cut being delivered. Furthermore, one must recall that the FOMC actually target the PCE inflation gauge, as opposed to its CPI cousin, and we also have a further two PCE reports due by the time of that meeting.
In short, every man and his dog will have likely forgotten this data by the time the June FOMC decision comes around. However, as recently as last week, Chair Powell was noting that it remains “too soon” to determine whether recent inflation data is more than a ‘bump’ – a report of this ilk, particularly the component breakdown, implies that the recent resurgence in price pressures could indeed be more than just a bump in the road, therefore tilting the balance of risks towards later, and fewer, cuts than previously thought.
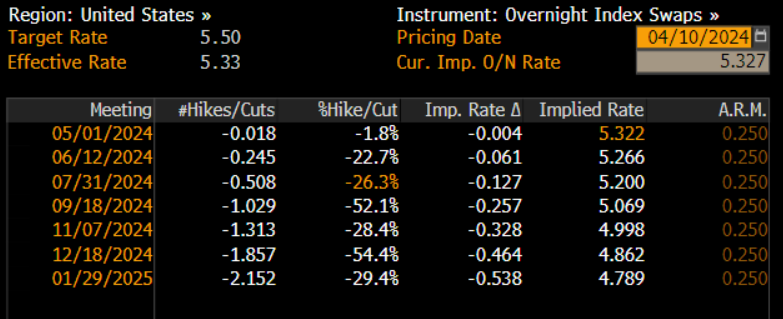
This was well-evidenced by the substantial hawkish reaction in the USD OIS curve to the data. Money markets now imply just a 20% chance of a June cut, down from around 60% pre-CPI, while also seeing a cut in July as just an even chance, compared to the certainty that it was prior to the release. The curve now fully prices the first cut for September, while pricing just 50bp of cuts in total during 2024, a significant divergence with the 75bp of easing that the March median dot implied.
Naturally, this move in rate expectations sparked a broader hawkish market reaction, with Treasuries and equities both selling off aggressively, as both the S&P and Nasdaq futures slipped more than 1%, while policy-sensitive 2-year Treasury yields rose a whopping 20bp form pre-release levels, charging towards the 5% handle. Gold also found sellers, as nominal rates surged, while the move in Treasuries also pushed the USD higher across the board, including forcing USD/JPY north of the 152 handle, which had by many been seen as a ‘line in the sand’ at which Japan’s MoF may seek to intervene.
On the whole, however, the data is a worrying sign for the FOMC, confirming that what had previously been dismissed as noise in hotter than expected January and February data, may well indeed be a signal that price pressures are stickier and more stubborn than expected. The balance of risks clearly points towards the FOMC remaining a hawkish outlier among G10 peers, as rate cuts loom elsewhere, likely continuing to underpin the greenback. Equities, meanwhile, should see dips remaining relatively shallow, and short-lived, as the policy outlook should remain supportive with cuts still on the table later this year, though earnings season – starting 12th April – will be the key near-term driver.
Related articles


Le matériel fourni ici n'a pas été préparé conformément aux exigences légales visant à promouvoir l'indépendance de la recherche en investissement et est donc considéré comme une communication marketing. Bien qu'il ne soit pas soumis à une interdiction de traiter avant la diffusion de la recherche en investissement, nous ne chercherons pas à tirer parti de cela avant de le fournir à nos clients. Pepperstone ne garantit pas que le matériel fourni ici est exact, actuel ou complet, et ne doit donc pas être utilisé comme tel. Les informations, qu'elles proviennent d'un tiers ou non, ne doivent pas être considérées comme une recommandation; ou une offre d'achat ou de vente; ou la sollicitation d'une offre d'achat ou de vente de toute sécurité, produit financier ou instrument; ou de participer à une stratégie de trading particulière. Cela ne tient pas compte de la situation financière des lecteurs ou de leurs objectifs d'investissement. Nous conseillons à tous les lecteurs de ce contenu de demander leur propre conseil. Sans l'approbation de Pepperstone, la reproduction ou la redistribution de ces informations n'est pas autorisée.