- Español
- English
- 简体中文
- 繁体中文
- Tiếng Việt
- ไทย
- Português
- لغة عربية
Analisis
3 Brexit pairs to trade
Trade talks have now finally reached the ‘intensive’ stage in the process of trying to reach a deal. The signs of potential progress mark a turnaround from late last week, when the UK threatened to walk away without any agreement unless the EU showed a ‘fundamental change of approach.’ The political posturing is no more (at least for now!), and the market has gained confidence from this. This has been further bolstered thanks to the extension of talks until Wednesday this week, from Sunday, and then in Brussels the next day, as positive signs continue to emerge.
Trade these three major Brexit related pairs and all the GBP crosses at Pepperstone today.
The bottom line: If a ‘thin’ deal gets announced, then sterling will rally because it would finally take the risk of an economic shock from a no deal off the table. But risks seem asymmetric and losses will be much larger should talks fail.
GBP/USD waiting for news
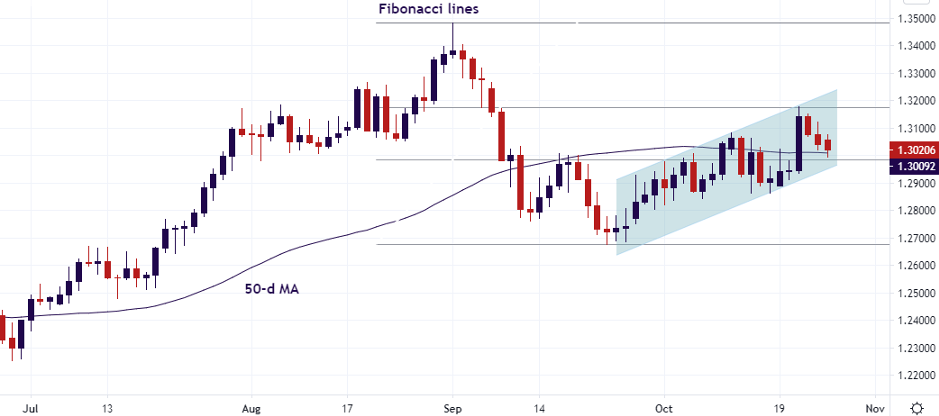
Cable has been buffeted by Brexit headlines over the last few months with acrimony and then modest agreement between the two camps. Most recently, swings in EUR/USD have determined price action in GBP/USD and this may remain the case as we await developments around a final agreement.

GBP/USD Daily Chart
We’ve seen an upward channel from the last week in September but the 61.8% Fib level of last month’s decline at 1.3174 acted as resistance last week. With prices now falling back to the 50-day moving average around 1.3014, having touched the 38.2% Fib level earlier Monday, can this act as a short-term floor?
EUR/GBP rangebound…ready for breakout?
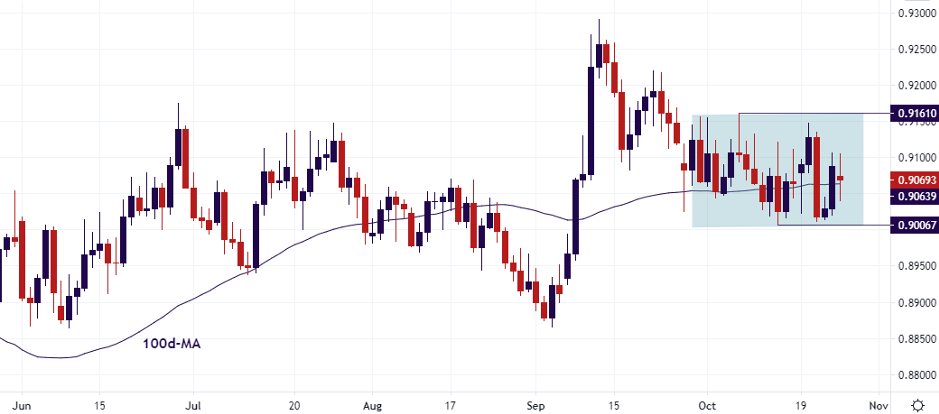
The pair most affected by Brexit has been trading in a relatively narrow range between 0.90 and 0.9160 for the last month. The sharp selloff last week was not able to push below the lower band and prices have been trading around the 100-day moving average.

EUR/GBP Daily Chart
The longer the pair compresses and coils, the bigger the breakout might potentially be and longer-term momentum is modestly for higher prices – that would mean negative news is on the horizon in terms of Brexit with the bulls aiming for the late and mid-September highs. Or might the ECB meeting Thursday have the capacity to see EUR/GBP break to the upside on a less dovish Lagarde?
On the flip side, if any substantial positive Brexit updates can push through 0.90, there is not much support before the September low at 0.8865.
FTSE 100 stuck in bearish channel
Given that 77% of FTSE100 revenues come from overseas, it is often assumed that there is negative relationship between sterling and the leading UK stock market. A weaker pound pushes the benchmark higher as repatriated earnings from abroad increase in value. But sometimes it isn’t so straight forward, especially as we need to consider wider global macro issues. The FTSE100 is weighted to financials, energy and material companies which means they have invariably been hit by the Covid-induced economic weakness, depressing both commodities and interest rates.

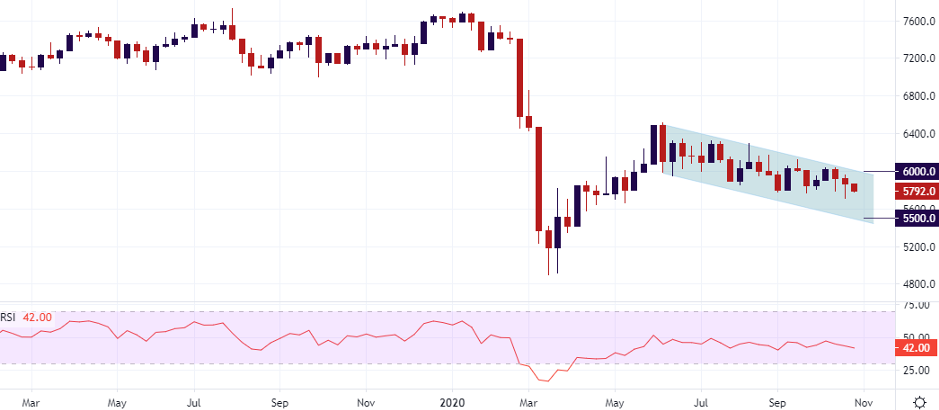
FTSE100 Weekly Chart
We can see the series of lower highs and lower lows that the index has carved out over the last few months on the weekly chart. The index is roughly midrange and looks set to go lower if it takes out last week’s low at 5716. Support after that would come at the lower part of the channel around 5500. The bulls will need to climb back to 6,000 to stop the downtrend.
¿Listo para operar?
Abrir una cuenta de Pepperstone es fácil. Aplique en minutos – incluso con un pequeño depósito. Comience su experiencia con Pepperstone hoy.
Pepperstone no garantiza que el material proporcionado aquí sea preciso, actual o completo, por lo tanto, no debe confiarse en él como tal. La información, ya sea de un tercero o no, no debe considerarse como una recomendación; o una oferta de compra o venta; o la solicitud de una oferta de compra o venta de cualquier valor, producto financiero o instrumento; o para participar en una estrategia de negociación en particular. No tiene en cuenta la situación financiera u objetivos de inversión de los lectores. Recomendamos a los lectores de este contenido que busquen su propio asesoramiento. Sin la aprobación de Pepperstone, no está permitida la reproducción o redistribución de esta información.