What is range trading and how do I use it in my strategy?
Range trading is a popular strategy that capitalises on price fluctuations within a defined range. This guide covers the basics of range trading, how it works, and how it might be incorporated into a trading strategy.
What is range trading?
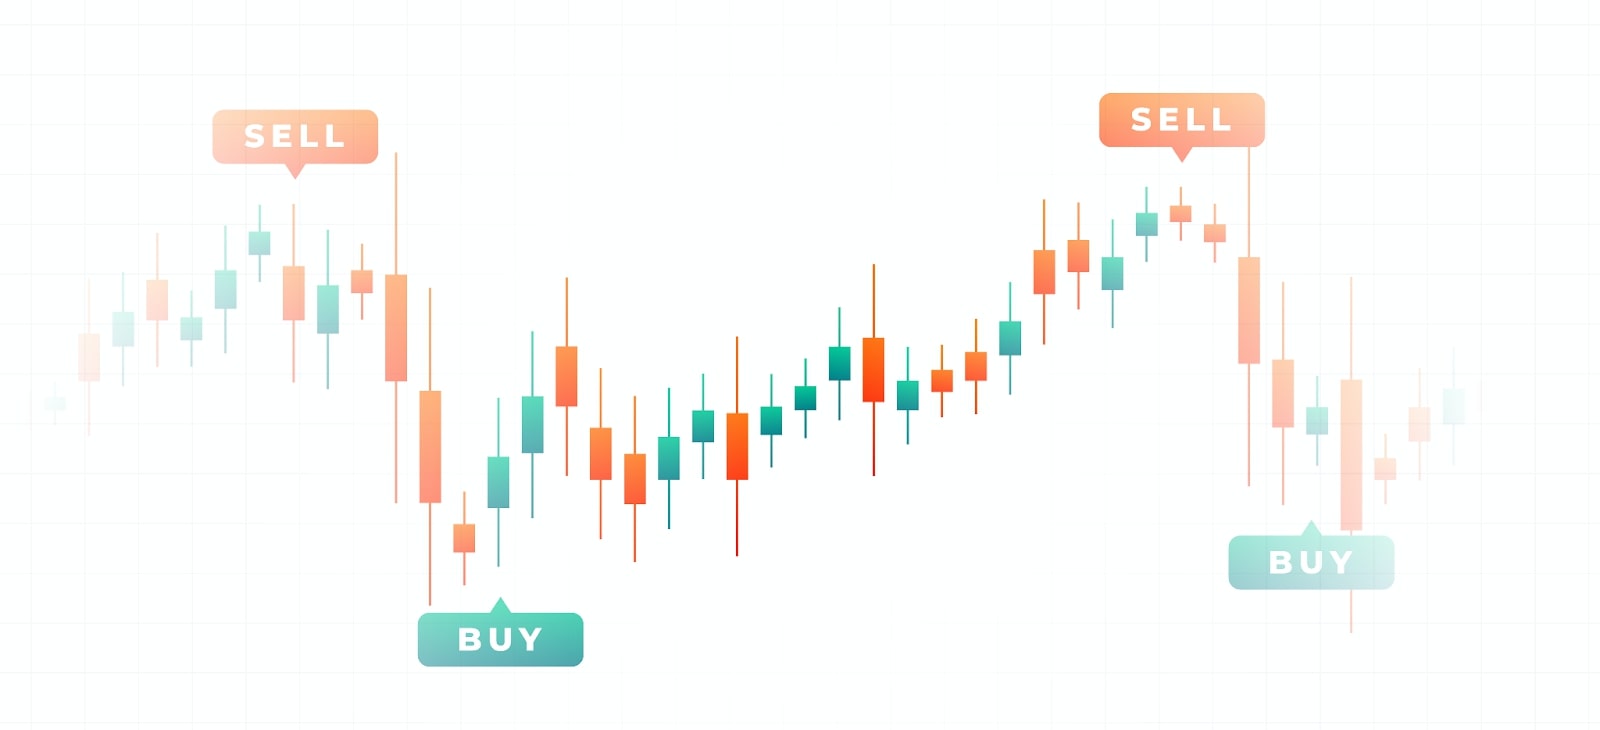
Range trading is a strategy based on the idea that prices often move within a defined range, bounded by support (the price level where demand is strong enough to prevent further declines) and resistance (the price level where selling pressure prevents further rises).
In range trading:
Traders buy near support levels, anticipating the price will bounce up from that level.
Traders sell near resistance levels, anticipating the price will fall from that level.
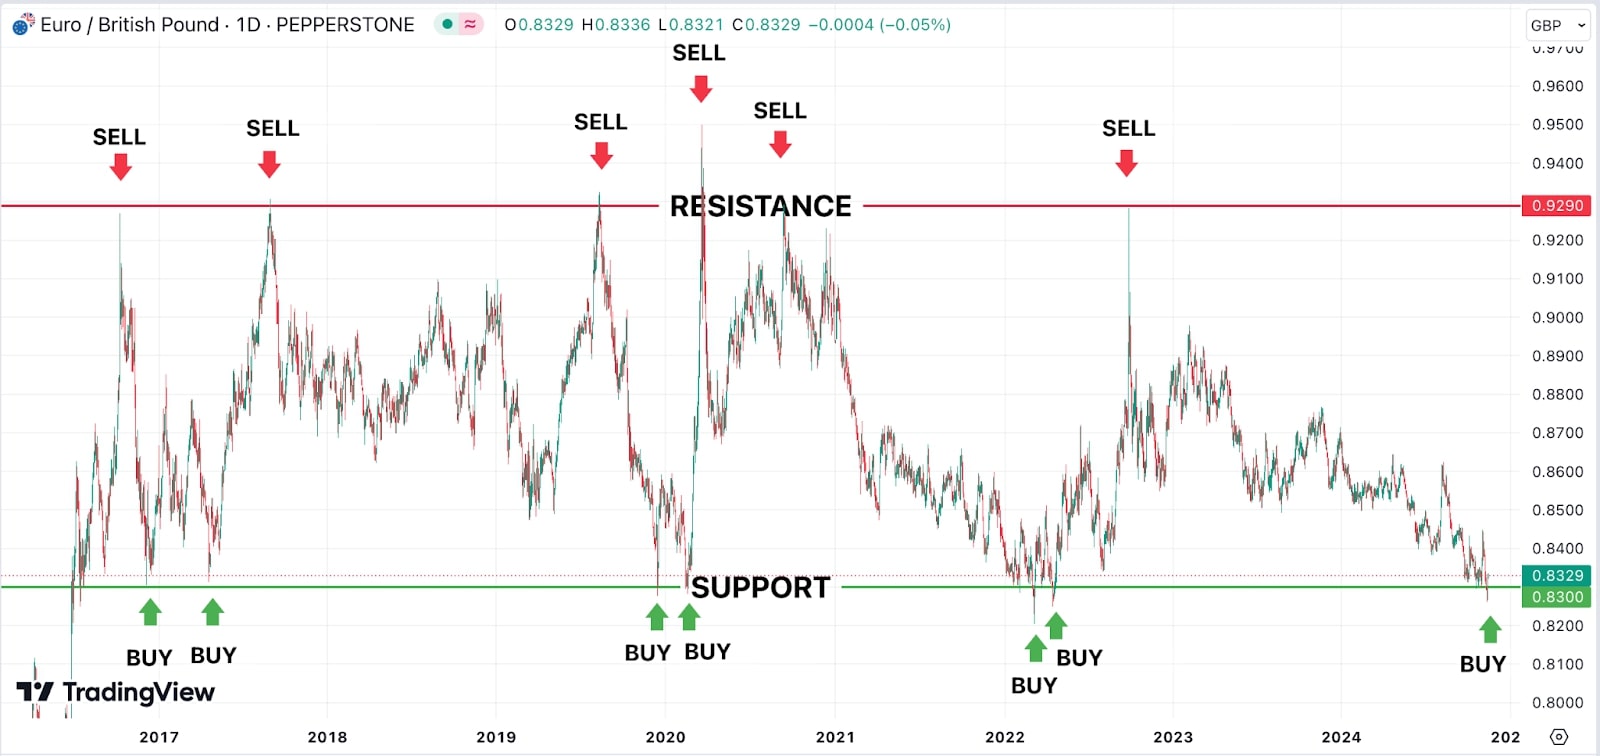
Be aware that lines identify ZONES of support and resistance as opposed to exact prices.
The range's middle section is generally seen as less appealing for placing trades, as there’s no major indication that the market is about to change direction. Range trading is most effective in sideways markets (non-trending markets) where prices fluctuate in a relatively stable band. It is less effective in strong uptrends or downtrends.
Why use range trading?
Range trading is suitable for markets where prices are oscillating back and forth without a clear trend. This style of trading offers several advantages:
- Relative simplicity: There is no need for complex analysis to determine a trend. Instead, focus on levels where prices repeatedly reverse over an extended period.
- Clear entry and exit points: By identifying support and resistance levels, range trading offers clear buy and sell points.
- Risk management: Range trading allows for relatively tight stop-loss placements, reducing exposure if the market breaks out of the range.
- Frequency of opportunities: Once a range is identified it can offer recurring opportunities in markets with predictable, oscillating price action.
Identifying a range in a market
To begin range trading, you can follow this process:
Identify support and resistance levels
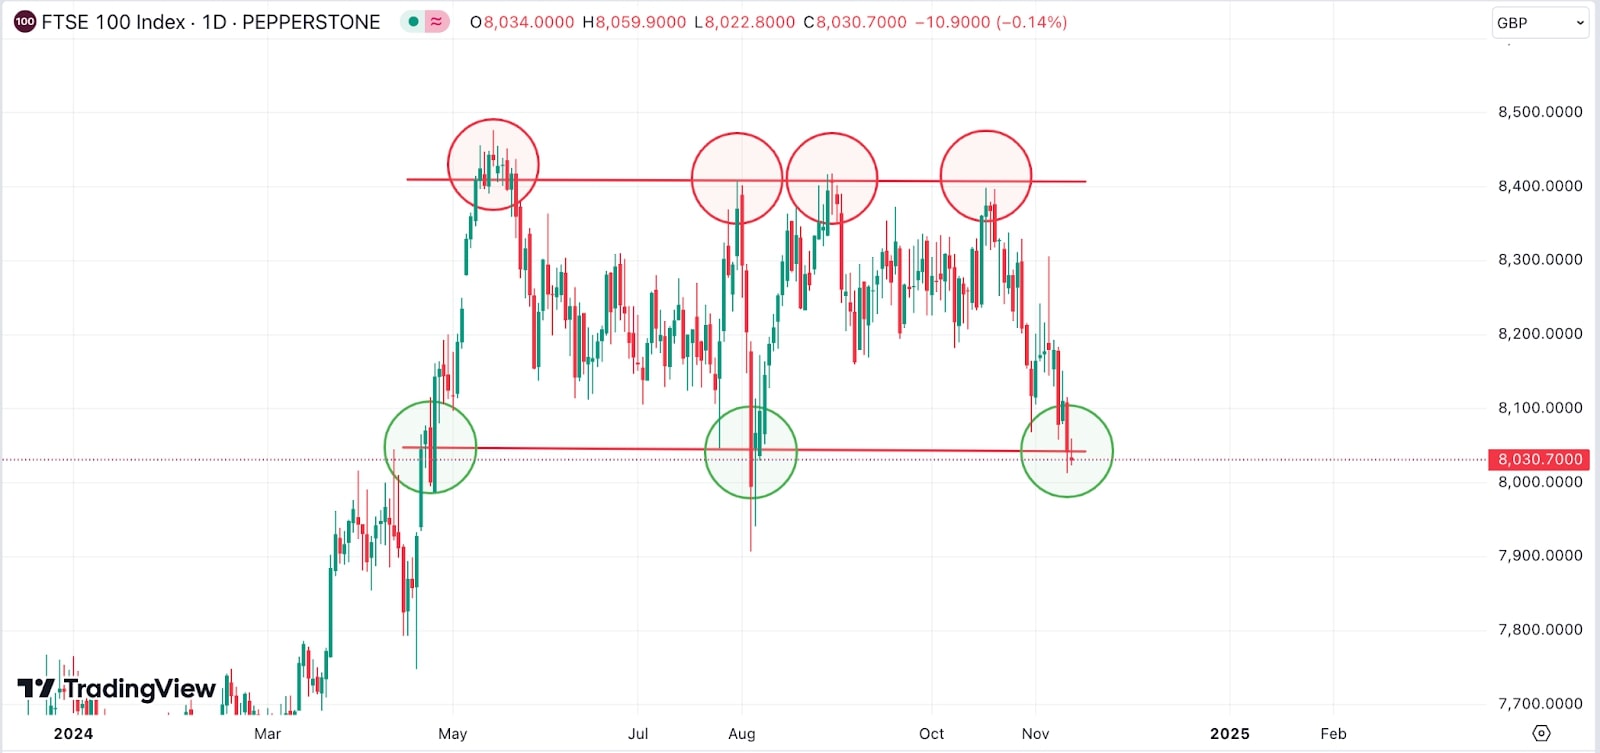
- Support: Look for a price level where the market has bounced up multiple times - for the FTSE100 example above, that would be around 8,050.
- Resistance: Look for a price level where the market has consistently turned down - for the FTSE100 example above, that would be around 8,400.
Sideways price action:
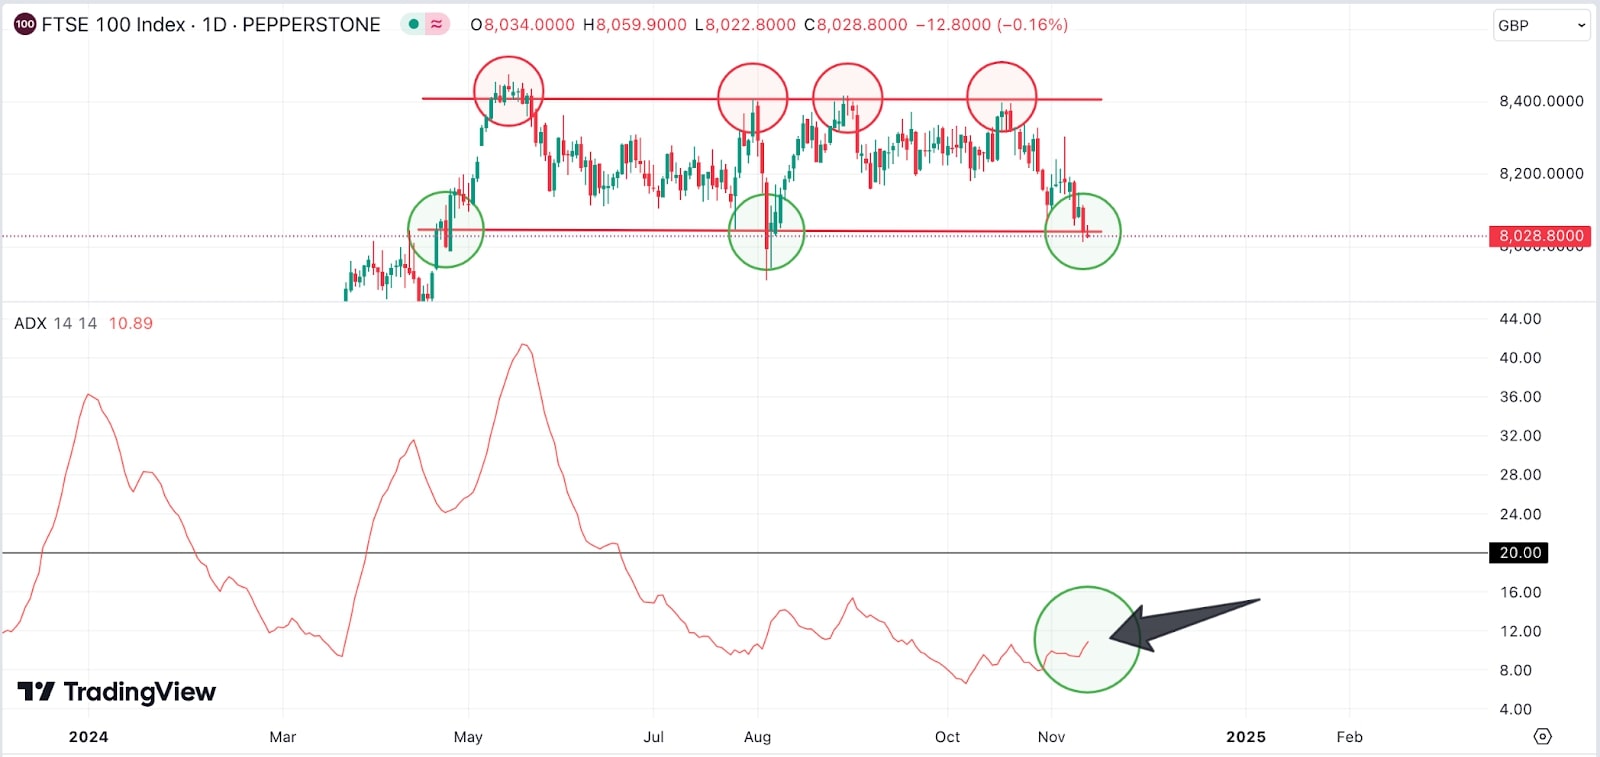
Indicators like the Moving Average or Average Directional Index (ADX) can help to confirm the market is not in a strong uptrend or downtrend. An ADX reading below 20-25 (see chart below) often indicates a non-trending (sideways) market, ideal conditions for range trading.
25 (see chart below) often indicates a non-trending (sideways) market, ideal conditions for range trading.
Candlestick patterns:
Look for reversal candlestick patterns (eg doji, hammer, shooting star) near support and resistance levels to confirm the range boundaries.
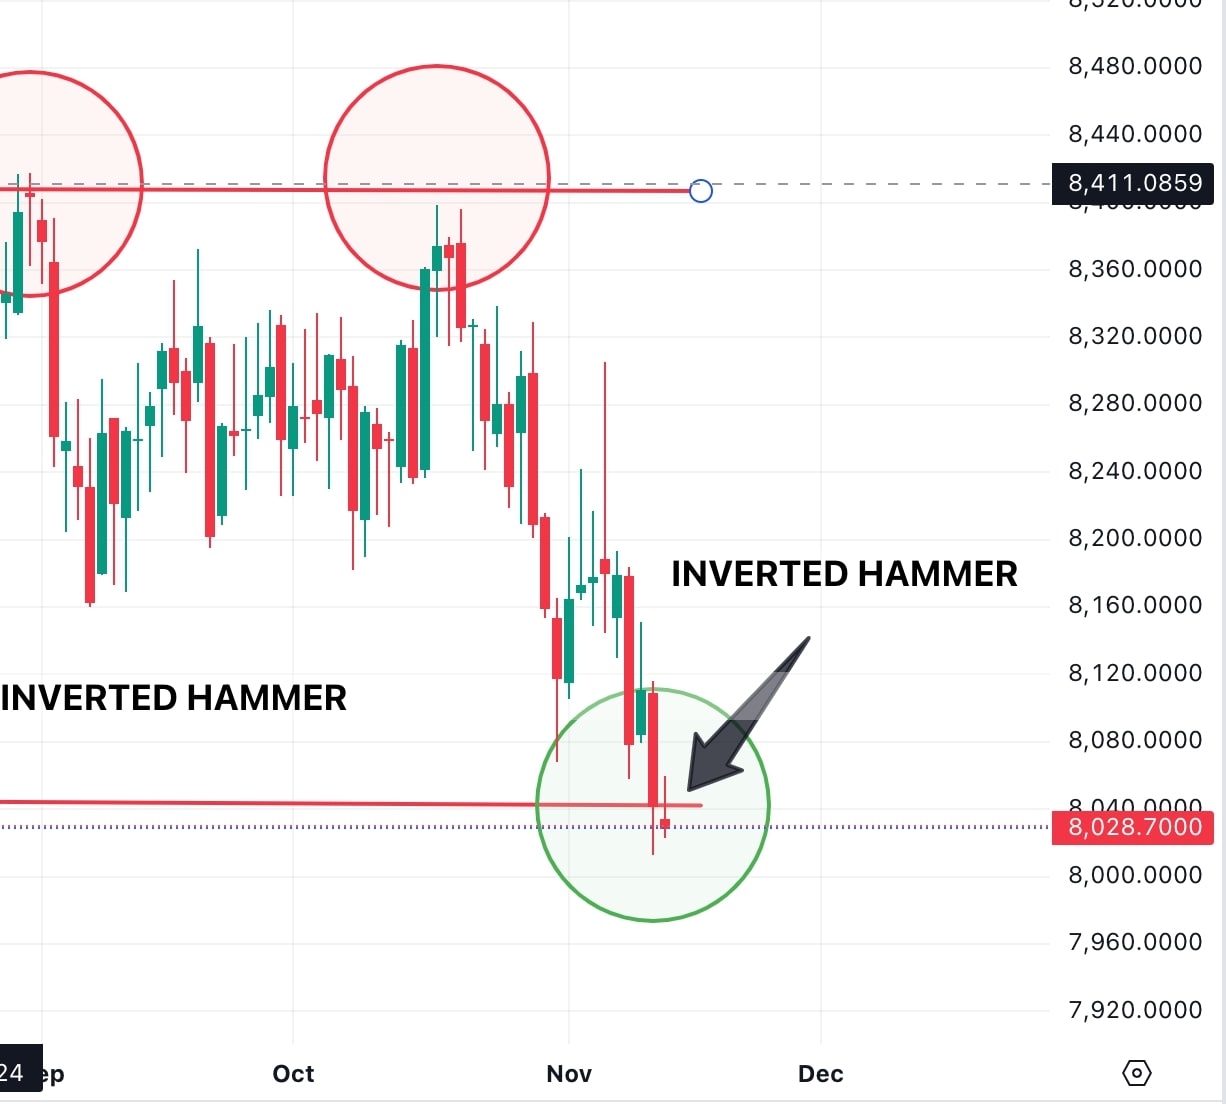
The example above displays an inverted hammer formation around the 8,000 level. This signals that although sellers have been in control, buyers are starting to show strength. If it’s followed by a bullish candle in the next session, it could confirm a reversal, suggesting that the downtrend might be ending and an upward move from the support could follow.
How should I use Average Directional Index (ADX) when range trading?
The Average Directional Index (ADX) measures the strength of a trend, helping to confirm if the market is indeed range-bound. A low ADX reading (typically below 20) suggests a weak trend, which is ideal for range trading as it confirms the absence of a strong directional movement. When ADX is low, traders can focus on trading between support and resistance.
For range traders, the 25 level serves as a key threshold to start monitoring for potential trend shifts. If the ADX continues to rise above 25, there is an increasing probability that a breakout or directional trend could occur, signalling that a switch to trend-trading strategies may be more appropriate.
For example, in 2022, the USD/JPY pair exhibited a clear transition from range-bound behaviour to a strong upward trending market, largely driven by diverging monetary policies between the Federal Reserve (raising rates aggressively) and the Bank of Japan (maintaining ultra-low rates). The ADX helped signal this shift, rising above 25 in February (chart below) suggesting that momentum was building even before March, with the trend gradually gaining strength.
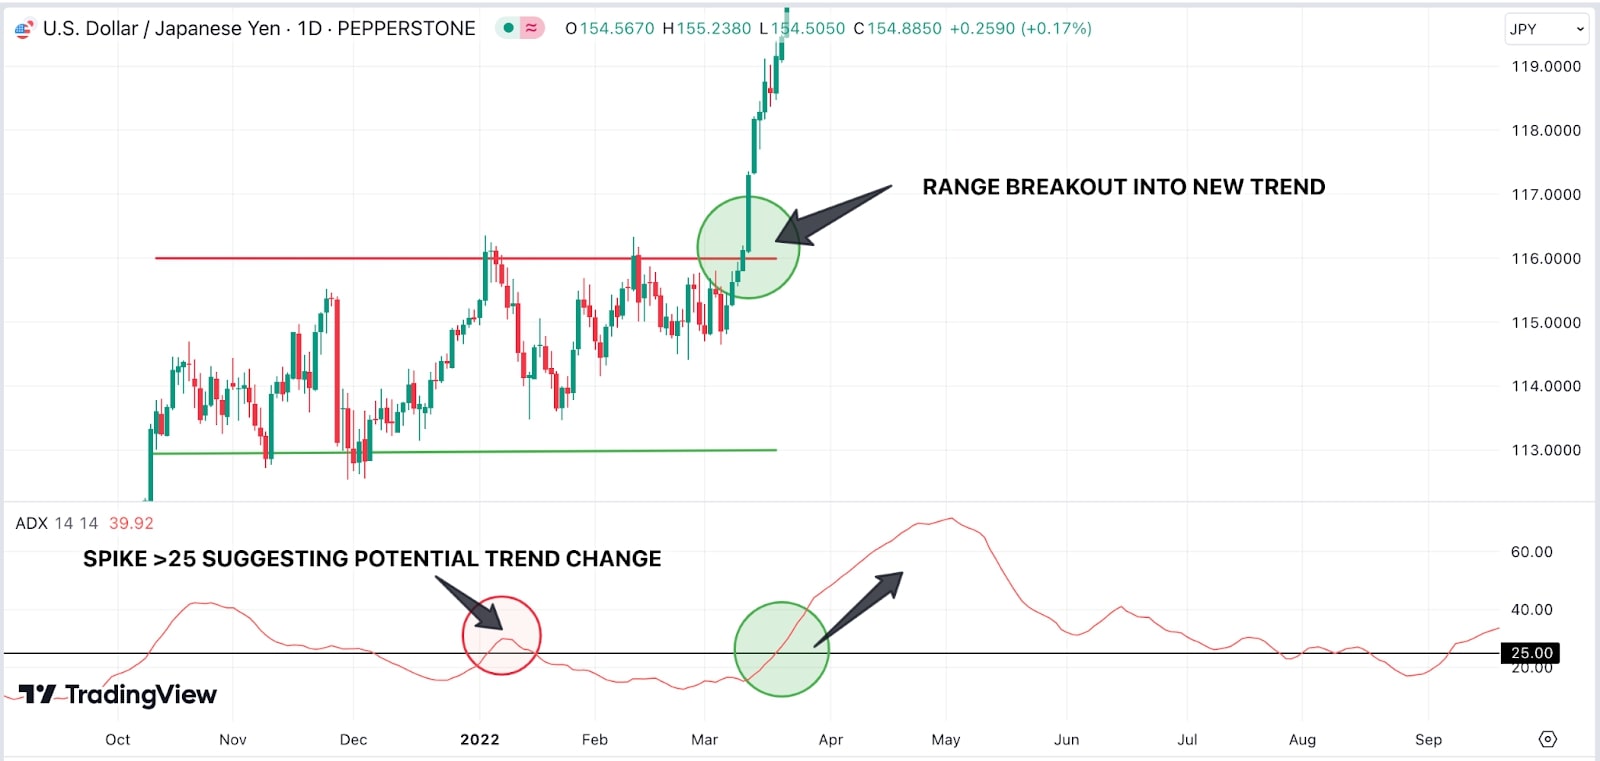
Around this time, the Federal Reserve announced it would begin an aggressive rate hike cycle, creating a strong fundamental driver for USD/JPY. As higher US interest rates made the dollar more attractive compared to the yen, the pair began to trend upward. This early ADX signal hinted that a breakout from the previous range (around 114-115) might be sustained. As USD/JPY began to accelerate upwards in March, the ADX continued to rise, reinforcing the strength of the trend.
Past performance is no guarantee of future results.
How to execute a range-trading strategy
Once a trading range has been identified, a range-trading strategy can be implemented with the following steps:
Decide your entry point
- Buying near support: Aim to enter long trades (buy) near the support level, where the price shows signs of rebounding.
- Selling near resistance: Aim to enter short trades (sell) near the resistance level, where the price shows signs of turning down.
Decide your exit point
Take profits at the opposite boundary: If buying near support, plan to sell near resistance, and vice versa. Some traders take partial profits halfway between support and resistance to lock in gains as the price approaches the opposite boundary.
Manage your risk with stop-losses
It may be sensible to place stop-loss orders below support when buying, and above resistance when selling. A stop-loss close to the entry level can help to minimise losses if the price breaks out of the range unexpectedly.
What is an example of a well-defined trading range?
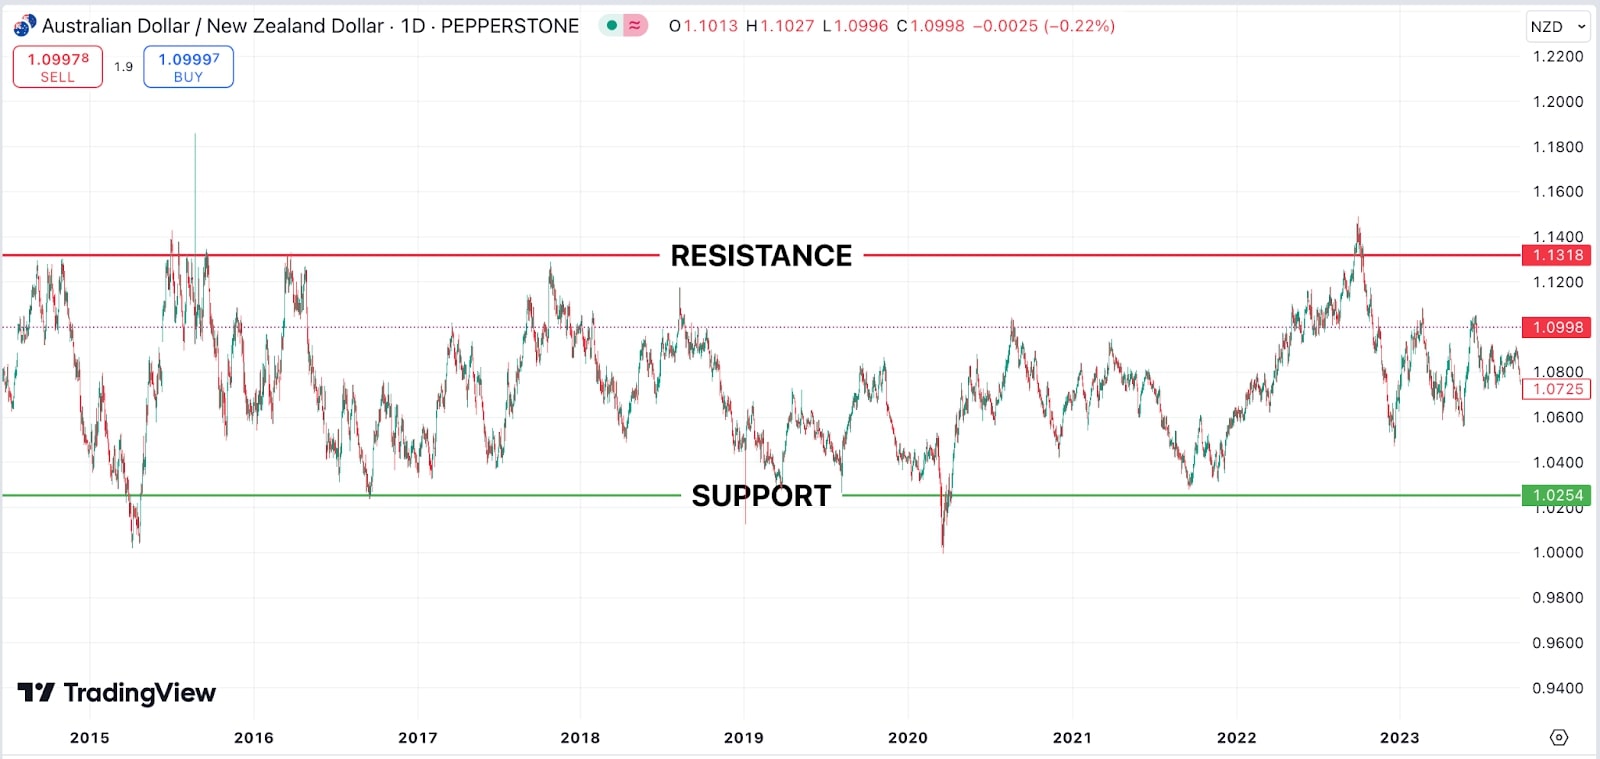
The AUD/NZD (Australian Dollar/New Zealand Dollar) pair is known for trading within a well-defined range. Here’s why this pair is often suitable for range trading and how to approach it:
Close economic and geographic ties
Australia and New Zealand are economically interconnected, with similar interest rates, inflation, and economic cycles. This interconnection keeps the currency pair from experiencing extreme trends over long periods.
Similar commodity-dependent economies
Both Australia and New Zealand have economies heavily reliant on commodities. While Australia is more influenced by metals (iron ore, coal), and New Zealand by agricultural exports (dairy, meat), both economies are still sensitive to global commodity trends, which can lead to stable, range-bound trading.
Limited influence of safe-haven flows
Unlike other currencies such as USD or JPY, neither AUD nor NZD is considered a global safe-haven currency. This makes AUD/NZD less susceptible to large spikes or collapses when global risk sentiment shifts, allowing the pair to stay within a range more consistently.
Typical range characteristics for AUD/NZD
AUD/NZD has traded in a range for years, highlighting its lack of a sustained trend. This range-bound behaviour can offer plenty of opportunity for range-trading strategies. During strong global risk events or commodity shifts, AUD/NZD has shown temporary breaks, but it tends to revert to the range shortly afterward.
Resistance
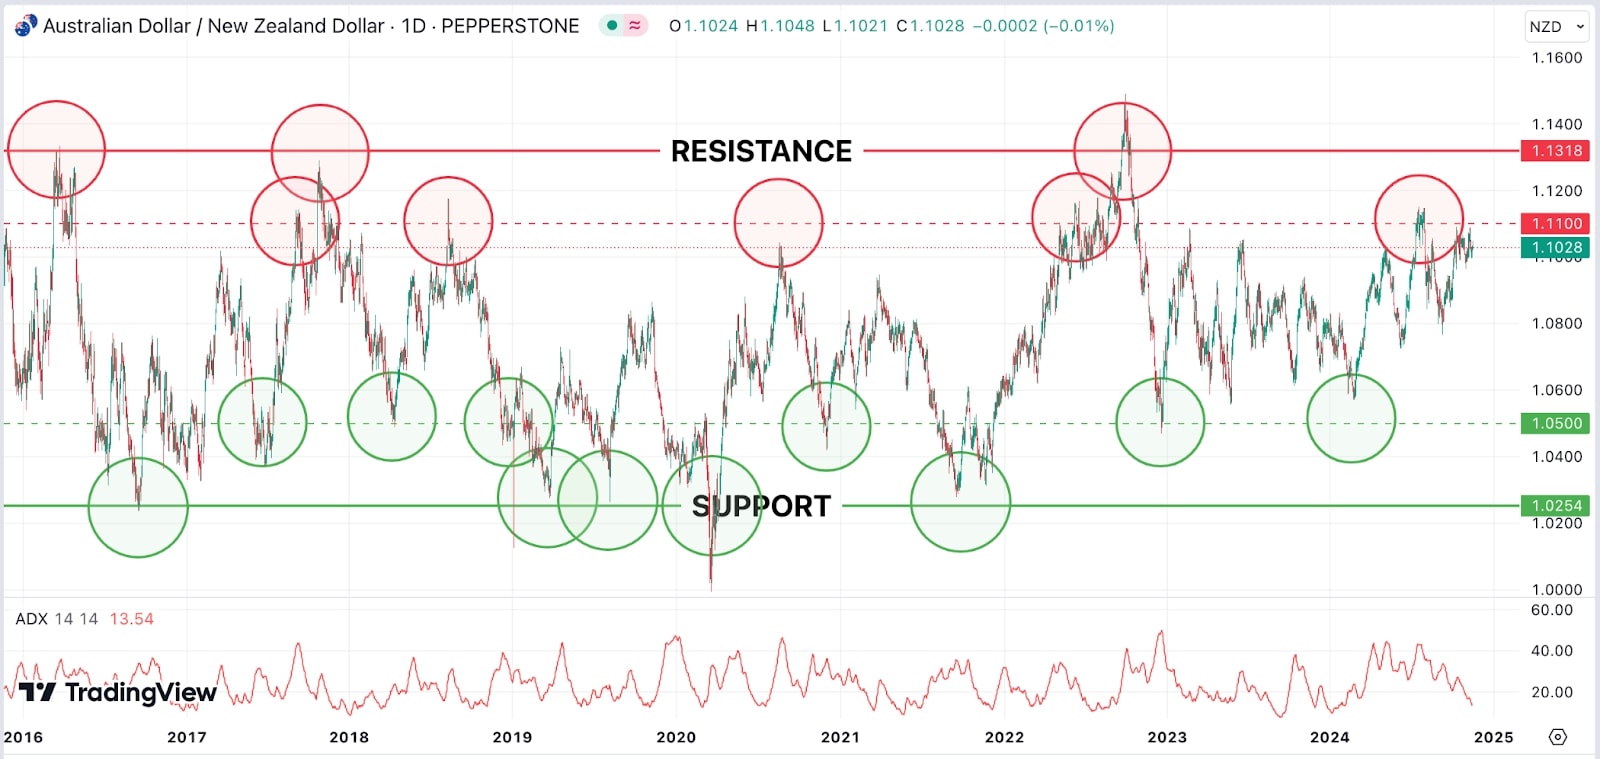
Level around 1.1300: This is the upper boundary of the range, where AUD/NZD repeatedly encounters selling pressure and reverses downward. This level represents strong resistance, as price spikes into this area are often followed by a decline, indicating that sellers dominate around this level.
Support
Level around 1.0250: The lower boundary is around 1.0250, where AUD/NZD finds consistent buying interest. Every time the price approaches this level, it tends to reverse upward, suggesting that buyers step in to prevent further declines.
Mid-range oscillations
Within the main range, AUD/NZD also has smaller oscillations. This creates opportunities for traders to identify sub-ranges or use mid-level points for partial profit-taking if prices do not reach the outer extremes. Within the broader AUD/NZD chart, the intermediate support and resistance levels of 1.1100 and 1.0500 sit within a broader trading range defined by the major resistance at 1.1300 and major support at 1.0250. These intermediate levels can serve as more frequent entry and exit points for range traders, who may look to sell near 1.1100 and buy near 1.0500 within this established range. Traders can monitor these intermediate levels as potential reversal zones or consolidation areas, waiting for confirmation (like candlestick patterns or momentum indicators) to identify possible buying or selling opportunities.
Range size
The range between the support at 1.0250 and resistance at 1.1300 is 1,050 pips. This wide range gives substantial room for traders to execute both buy and sell positions at each extreme. This range has been in place for several years, highlighting the stability and predictability of AUD/NZD’s oscillations within this band.
Medium-term reversals
The pair exhibits medium-term reversals each time it hits the support or resistance. These reversals tend to last for several months, allowing swing traders to capture significant moves between the two levels.
Does range trading differ across asset classes?
Range trading does differ between stock indices, currencies, and commodities because each market has its unique characteristics, influences, and trading behaviours. Here’s an overview of how range trading can vary across these asset classes:
Currencies
- Characteristics: Currency pairs, especially those involving stable, closely connected economies (like AUD/NZD or EUR/CHF), often exhibit strong range-bound behaviour. These pairs tend to stay within ranges due to balanced economic relationships, similar interest rates, and limited exposure to dramatic, one-sided trends.
- Influences: Forex ranges are often influenced by factors such as central bank policies, economic data releases, interest rate differentials, and global risk sentiment. Central banks play a significant role in maintaining stability within currency pairs, leading to consistent support and resistance levels.
- Volatility: Currency pairs generally have lower volatility compared to commodities, which makes range trading smoother and more predictable. However, some pairs are more prone to trend shifts, especially those involving the USD, which can quickly react to global events.
- Range-trading approach: Range traders in Forex often use oscillators like RSI and Bollinger Bands to identify overbought and oversold conditions within the range. Traders may also monitor support and resistance levels but should be cautious about sudden shifts due to central bank intervention or geopolitical news.
Stock indices
- Characteristics: Stock indices (such as the S&P 500, NASDAQ, or FTSE 100) typically have a long-term upward bias because they represent a group of prominent companies in an economy. Range-bound behaviour in indices is often seen during consolidation phases rather than as a long-term pattern.
- Influences: Indices are heavily influenced by macroeconomic data, corporate earnings, central bank policies, and investor sentiment. Periods of range-bound movement can occur during low volatility or periods of uncertainty (e.g. sideways movement while investors await a Fed decision or major earnings reports).
- Volatility: Indices can experience significant volatility due to shifts in market sentiment, earnings season, and macroeconomic data. Although they often have a slight upward drift, indices can also experience extended periods of range-bound movement, especially in periods of low growth or consolidation.
- Range trading approach: Traders who range trade indices typically look for consolidation periods or levels where the index has been repeatedly supported or capped. Moving averages and volume-based indicators can help in identifying when an index may break out of a range. Due to the upward bias, range traders often lean toward buying near the lower end of the range and avoid shorting at the upper end, preferring to wait for a breakout instead.
Commodities
- Characteristics: Commodities like gold, oil, and silver are often prone to range-bound behaviour, but they also experience sharp trends depending on supply and demand dynamics. Commodities frequently move in cycles and can have well-defined ranges when supply/demand factors are relatively balanced.
- Influences: Commodity prices are driven by specific supply-and-demand factors. For instance, oil prices are affected by OPEC decisions, geopolitical events, and production data, while gold often moves with changes in interest rates, inflation expectations, and risk sentiment.
- Volatility: Commodities can be highly volatile, especially due to sudden supply or demand shocks. This volatility can lead to quick breaks of established ranges, making range trading more challenging.
- Range-trading approach: When commodities are in a range, traders focus heavily on technical analysis and use oscillators like RSI and MACD to gauge potential reversals within support and resistance zones. However, due to high volatility, they often set wider stops or use smaller position sizes to account for potential price swings. Traders also monitor fundamental news closely (e.g. oil inventory reports) to anticipate potential breakouts from established ranges.
Risk management in range trading
Like any strategy, range trading requires a sensible approach to risk management. Here are a few factors to consider:
- Stop-loss orders: Think about placing stop-loss orders slightly beyond support (for long trades) or resistance (for short trades), to avoid large losses in case of a breakout.
- Position sizing: the size of your position, especially when employing leverage, can amplify your potential profit and loss. Ensure you’re not risking too much of your trading capital.
- Stay disciplined: If the market breaks out, don’t re-enter without confirming a new range or trend; trying to trade outside the range could increase risk unnecessarily.
Positives and negatives of range trading
Positives:
- Offers frequent trading opportunities
- Clear entry and exit levels can make it easier to plan trades
- Allows for tight stop-loss placement, reducing risk on each trade
Negatives:
- Vulnerable to breakouts, which can lead to unexpected losses
- May produce false signals in highly volatile markets
- Limited profit potential, as prices oscillate within a fixed range
Past performance is no guarantee of future results.
The material provided here has not been prepared in accordance with legal requirements designed to promote the independence of investment research and as such is considered to be a marketing communication. Whilst it is not subject to any prohibition on dealing ahead of the dissemination of investment research we will not seek to take any advantage before providing it to our clients.
Pepperstone doesn’t represent that the material provided here is accurate, current or complete, and therefore shouldn’t be relied upon as such. The information, whether from a third party or not, isn’t to be considered as a recommendation; or an offer to buy or sell; or the solicitation of an offer to buy or sell any security, financial product or instrument; or to participate in any particular trading strategy. It does not take into account readers’ financial situation or investment objectives. We advise any readers of this content to seek their own advice. Without the approval of Pepperstone, reproduction or redistribution of this information isn’t permitted.