5 advanced candlestick patterns that every experienced trader should know
Candlestick patterns are a key tool for traders to understand market trends. Explore five advanced candlestick patterns and learn how to use them to spot potential trading opportunities.
These are relatively rare and sometimes convoluted patterns and deserve caution and confirmation before acting upon them. We’ll start with the less complex formations and build-up to the more complicated and rare.
New to trading and would like to learn more about candlestick patterns? If so, check out Pepperstone’s beginners guide on what are candlestick charts and how to read them and 5 candlestick charts that every trader should know.
What main candlestick patterns should I consider as an ‘advanced’ level trader?
1 - Abandoned Baby (Bullish and Bearish)
Another compelling version of the Doji star is the abandoned baby top or bottom. This pattern is the equivalent to what some know as the ‘island reversal’. The abandoned baby candlestick has a doji as the second candle with a gap on both sides. If you think about the psychology of this setup, the first gap came in an exhaustive fashion. The market was already in a strong uptrend or downtrend, and then it made a gap that closed near its opening. This was the first sign that the directional pressure was fading. It is worth noting that the more significant the gap, the greater the signal.
_candlestick_patterns-min.jpg)
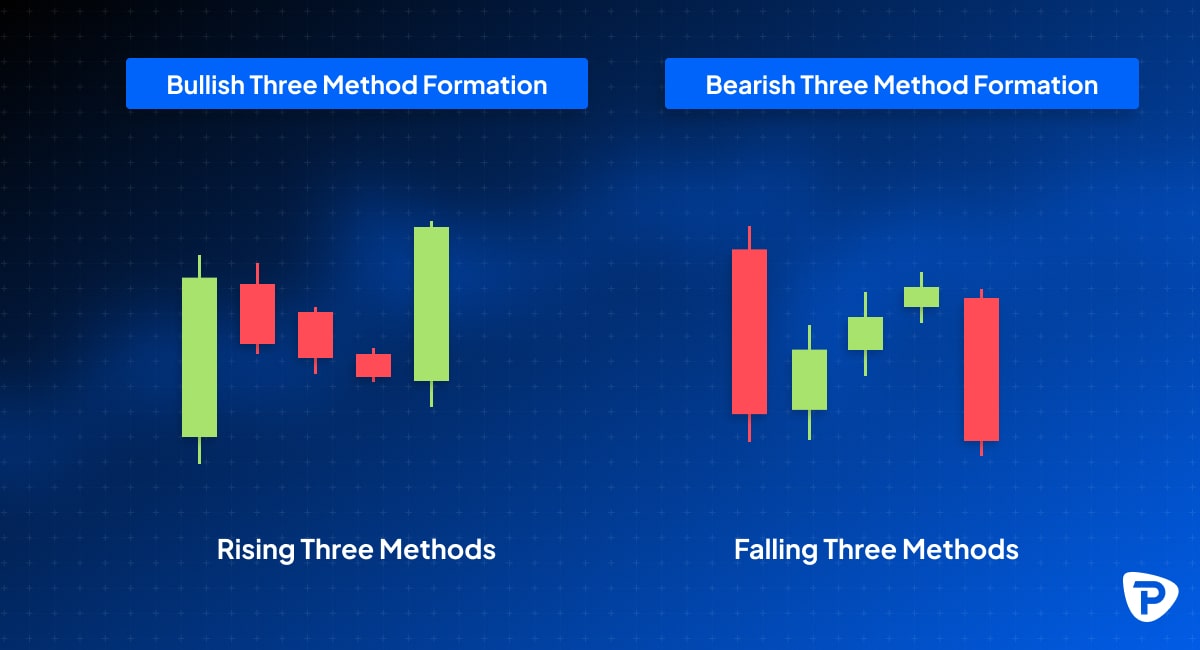
2 - Rising and Falling Three Methods
The Three Methods candlestick pattern is a trend continuation pattern seen in both uptrends and downtrends. In an uptrend, it's called the Rising Three Methods; in a downtrend, it's known as the Falling Three Methods. Despite its name, this pattern typically involves five candlesticks but can include four or more. The pattern indicates a pause or consolidation in the market during a rally or decline.

3 - The Tower (Bullish and Bearish)
The Tower Top and Tower Bottom are classic patterns in technical analysis that often signal trend reversals after a period of sideways price movement.
- First Candlestick: A large candlestick with a big real body that aligns with the current trend.
- Middle Candlesticks: Several smaller candlesticks (usually three) that move against the trend but remain within or near the range of the first candlestick.
- Final Candlestick: Another large candlestick that supports the original trend, opening above the preceding small candle's close and closing above the first candlestick's close.
_candlestick_patterns-min.jpg)
The pattern resembles small countertrend candlesticks flanked by two large trend-supporting candlesticks. It is more reliable when the first and last candlesticks have little to no upper or lower shadows.
- Tower Top: The bullish phase may consist of several small bullish (green) candlesticks or a single large bullish candle. This is followed by lateral price movement with small candlesticks forming the top of the "tower." The pattern concludes with one or more large bearish (red) candlesticks, indicating the end of the flat trend and the beginning of a downtrend. The pattern is invalid if the bearish candlestick(s) are not extended.
- Tower Bottom: This is the opposite, starting with bearish candlesticks, then sideways movement, and concluding with a large bullish candlestick, signalling an uptrend.
Correctly identifying Tower Top and Bottom patterns is crucial, as they can be strong market indicators. Misinterpretation can lead to significant losses. It's important to distinguish a genuine Tower Top from a false signal, as a genuine Tower Top often results in a substantial price drop. Confirmation through key support levels is needed before acting. Careful analysis and patience are required to confirm these patterns.
4 - Kicker Pattern (Bullish and Bearish)
The Kicker pattern features two candlesticks: the first aligns with the current trend, while the second sharply reverses, forming a significant gap. This pattern is known for signalling abrupt shifts in market sentiment, providing traders with an early opportunity to adjust their positions.
-min.jpg)
- First Candle: The first candlestick reflects the prevailing trend. For example, in an uptrend, a long green candle indicates strong buying pressure. Conversely, a long red candle shows intense selling pressure in a downtrend.
- Second Candle: The second candle opens with a significant gap in the opposite direction of the first candle. This gap indicates a dramatic change in market sentiment. If the first candle were green, the second would be red, and vice versa.
- Gap Significance: The gap between the two candles is crucial as it highlights the abrupt change in market sentiment. This gap represents a shift from strong buyer control to strong seller control or the opposite.
5 - Three-Line Strike (Bullish and Bearish)
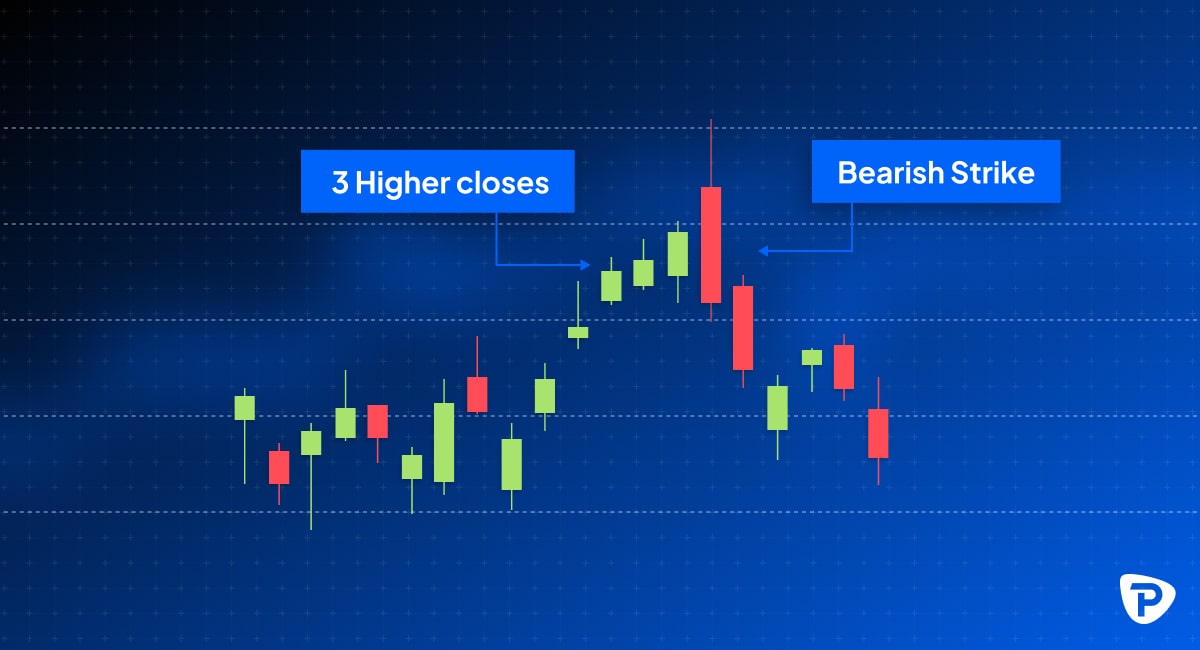
The Three-Line Strike is typically seen as a continuation pattern, a complex and often discussed pattern. Still, backtesting shows it frequently signals a sudden shift in market sentiment and direction. Its rarity and unexpected outcomes make it advisable to use other indicators, such as volume and trend filters, for confirmation. With a success rate believed to be over 80%, it is a valuable albeit rare pattern for predicting trend reversals. Note trading strategies involve risk and past success does not guarantee future results.
_candlestick_patterns-min.jpg)
Start by identifying a clear market trend. This pattern can occur in both uptrends (bullish) and downtrends (bearish). Look for three consecutive candles of the same colour that align with the trend: green (or white) candles closing higher for a bullish pattern and red (or black) candles closing lower for a bearish one. The fourth candle, known as the "strike," opens with the trend but closes in the opposite direction, beyond the first candle's opening. In a bullish setup, the strike candle is red (or black); in a bearish setup, it's green (or white). The first three candles should be similar in size, showing consistent momentum, while the strike candle should be larger, engulfing the three, indicating a strong momentum shift. Despite being called bullish or bearish, the strike candle hints at the next move.

Some typical questions asked about advanced candlestick patterns
How can I integrate candlestick patterns with advanced technical analysis methods such as Elliott Wave Theory or Ichimoku Cloud?
Candlestick Patterns with Elliott Wave Theory:
Elliott Wave Theory identifies repeating price movement patterns, typically five waves in the direction of the trend, followed by three corrective waves.
How to Integrate:
- Identifying Wave Completions: Candlestick patterns can help confirm wave completions. For instance, a Bullish Engulfing at the end of a corrective wave (Wave 2 or Wave 4) may signal the start of the next impulse wave.
- Reversal at Wave 5: Look for reversal patterns like the Shooting Star or Bearish Engulfing at the end of Wave 5, which often indicates a trend reversal or the beginning of a corrective phase.
- Wave 3 Confirmation: Wave 3 is typically the strongest, and continuation patterns like Rising Three Methods can confirm the trend's ongoing strength during this phase.
Candlestick Patterns with Ichimoku Cloud:
The Ichimoku Cloud is a versatile indicator offering insights into trend direction, support and resistance, and momentum.
How to Integrate:
- Price Action Relative to the Cloud: Candlestick patterns can confirm trends based on their position relative to the cloud. A Bullish Engulfing above the cloud signals continued uptrend strength, while a Bearish Engulfing below the cloud suggests further downside.
- Kijun and Tenkan Crossovers: Combine candlestick patterns with Kijun-Tenkan crossovers for confirmation. For instance, a Hammer forming near the Kijun line after a bullish crossover supports a strong uptrend.
- Chikou Span Confirmation: If the Chikou Span (lagging line) aligns with the trend, patterns like the Morning Star near cloud support offer strong entry signals.
What statistical methods can I use to quantify the effectiveness of candlestick patterns?
The following metrics would be applicable:
Backtesting, Win/Loss Ratio, Profit Factor, Accuracy (Hit Rate), Statistical Significance (Z-Test), Sharpe Ratio, Precision and Recall (for machine learning), Expected Value (EV), Monte Carlo Simulation, and Risk-Reward Ratio. All these are best applied by subscribing to historical data and investing in the appropriate software to run the preferred programs.
How can I use volume profile and order flow analysis to confirm candlestick patterns?
Using volume profile and order flow analysis alongside candlestick patterns offers more profound insights into market sentiment and can help confirm potential price movements.
Volume Profile to Confirm Candlestick Patterns:
- Volume Profile highlights the volume traded at each price level, helping identify critical support and resistance levels.
- Identifying Key Levels: A candlestick pattern near a high-volume area (Point of Control or POC) confirms significance. For example, a Bullish Engulfing pattern at high-volume support suggests strong buying interest, increasing the chances of a reversal.
- Low-Volume Zones: A Shooting Star or Bearish Engulfing near a low-volume area indicates weak price participation, making a reversal more likely.
- Example: A Hammer forming at the lower end of a high-volume area signals strong support, confirming a potential bullish reversal.
Order Flow Analysis for Candlestick Confirmation:
- Order Flow Analysis tracks buying and selling pressure, confirming candlestick patterns.
- Buy and Sell Imbalances: A bullish candlestick with rising buy orders confirms buying pressure. Similarly, a bearish pattern with a surge in sell orders strengthens the bearish signal.
- Absorption and Rejection: Large buy/sell orders filled with minimal price movement (absorption) can confirm support or resistance.
- Bid/Ask Spread: A narrowing spread with a reversal pattern like a Hammer shows buyers gaining control.
- Example: A Shooting Star near resistance, confirmed by increasing sell orders through order flow analysis, supports a potential downtrend.
Combining Volume and Order Flow with Candlestick Patterns:
- Combining volume profile and order flow with candlestick patterns provides more profound confirmation.
- Volume Profile + Candlestick Patterns: Candlestick patterns near high-volume nodes confirm key support/resistance levels, while order flow indicates whether buyers or sellers are dominant.
- Order Flow + Candlestick Patterns: An increase in buying or selling pressure seen through order flow validates the pattern.
- Example: A Bearish Engulfing in a low-volume zone, confirmed by heavy sell orders in the order flow, suggests a potential breakdown.
Final thoughts on advanced candlestick chart patterns
These patterns provide advanced traders with nuanced insights into market dynamics. They can be powerful alongside alternative technical analysis tools like moving averages, trend lines, and volume analysis to confirm signals and make well-informed trading decisions. You can explore these candlestick patterns and other technical indicators through your Pepperstone live or demo account.
The material provided here has not been prepared in accordance with legal requirements designed to promote the independence of investment research and as such is considered to be a marketing communication. Whilst it is not subject to any prohibition on dealing ahead of the dissemination of investment research we will not seek to take any advantage before providing it to our clients.
Pepperstone doesn’t represent that the material provided here is accurate, current or complete, and therefore shouldn’t be relied upon as such. The information, whether from a third party or not, isn’t to be considered as a recommendation; or an offer to buy or sell; or the solicitation of an offer to buy or sell any security, financial product or instrument; or to participate in any particular trading strategy. It does not take into account readers’ financial situation or investment objectives. We advise any readers of this content to seek their own advice. Without the approval of Pepperstone, reproduction or redistribution of this information isn’t permitted.