Platforms

Autochartist

Autochartist Technical analysis can quickly and effectively give you access to 1000’s of real-time opportunities. The tool provides you with built-in filtering functionality to personalise your experience. It saves you time and highlights different trading options to keep you informed on market movements.

Analysis types

Chart Patterns

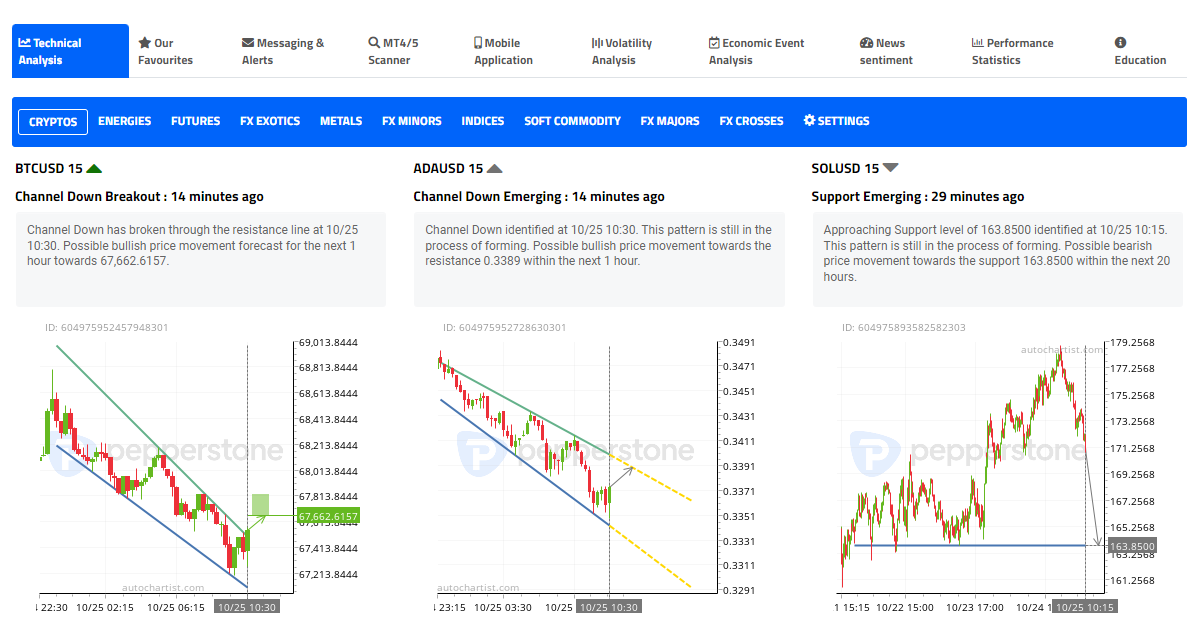
Chart pattern formations that are identified by Autochartist include wedges, triangles, channels, rounding tops and bottoms, and many other patterns. Autochartist also indicates when the price action will reach a predicted target area.

Key Levels

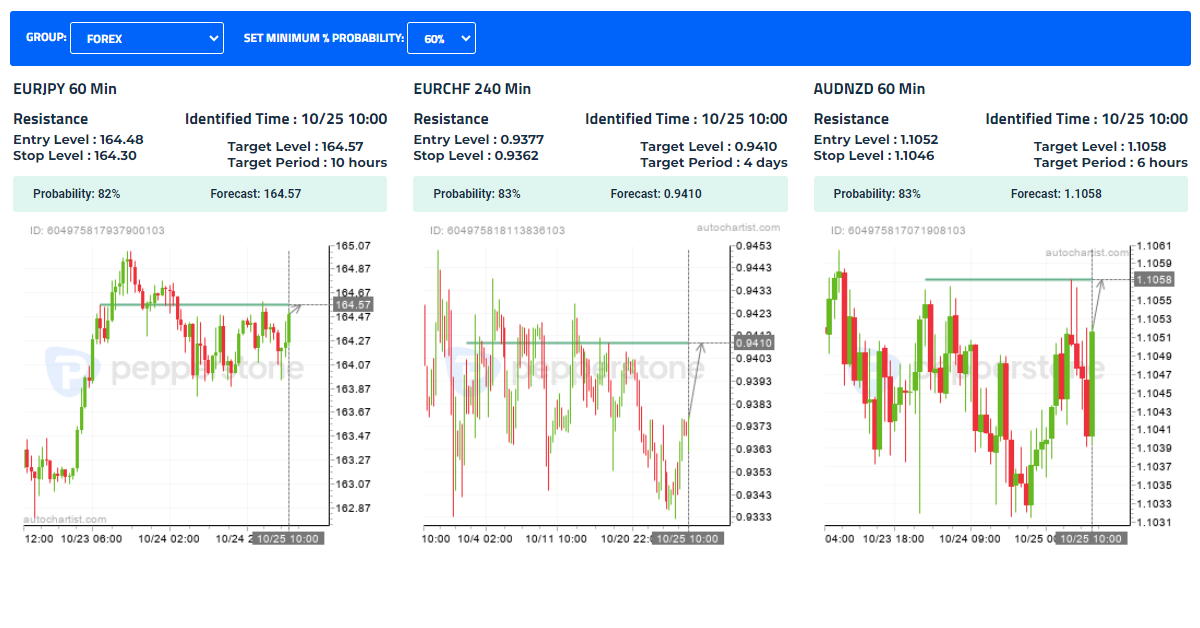
Autochartist Key Levels identify support or resistance levels at significant price levels. This is the most popular analysis type as it is loved by all types of traders. It is simple to understand and great for traders irrespective of their experience level.

Statistical Patterns

Everyone wants to know where the exceptionally large movements in the markets are, as the question is always “What is going to happen next?”. The Autochartist Big Movements and Consecutive Candle Statistical Patterns automatically identify large movements in the market.

Fibonacci Patterns

Autochartist automatically identifies Fibonacci Patterns that can visually illustrate certain levels at which either support or resistance is anticipated, according to the Golden Ratio theory. Levels like that can play an instrumental role in setting up stop-loss levels and identifying trading objectives.

Email Reports

Autochartist for MetaTrader

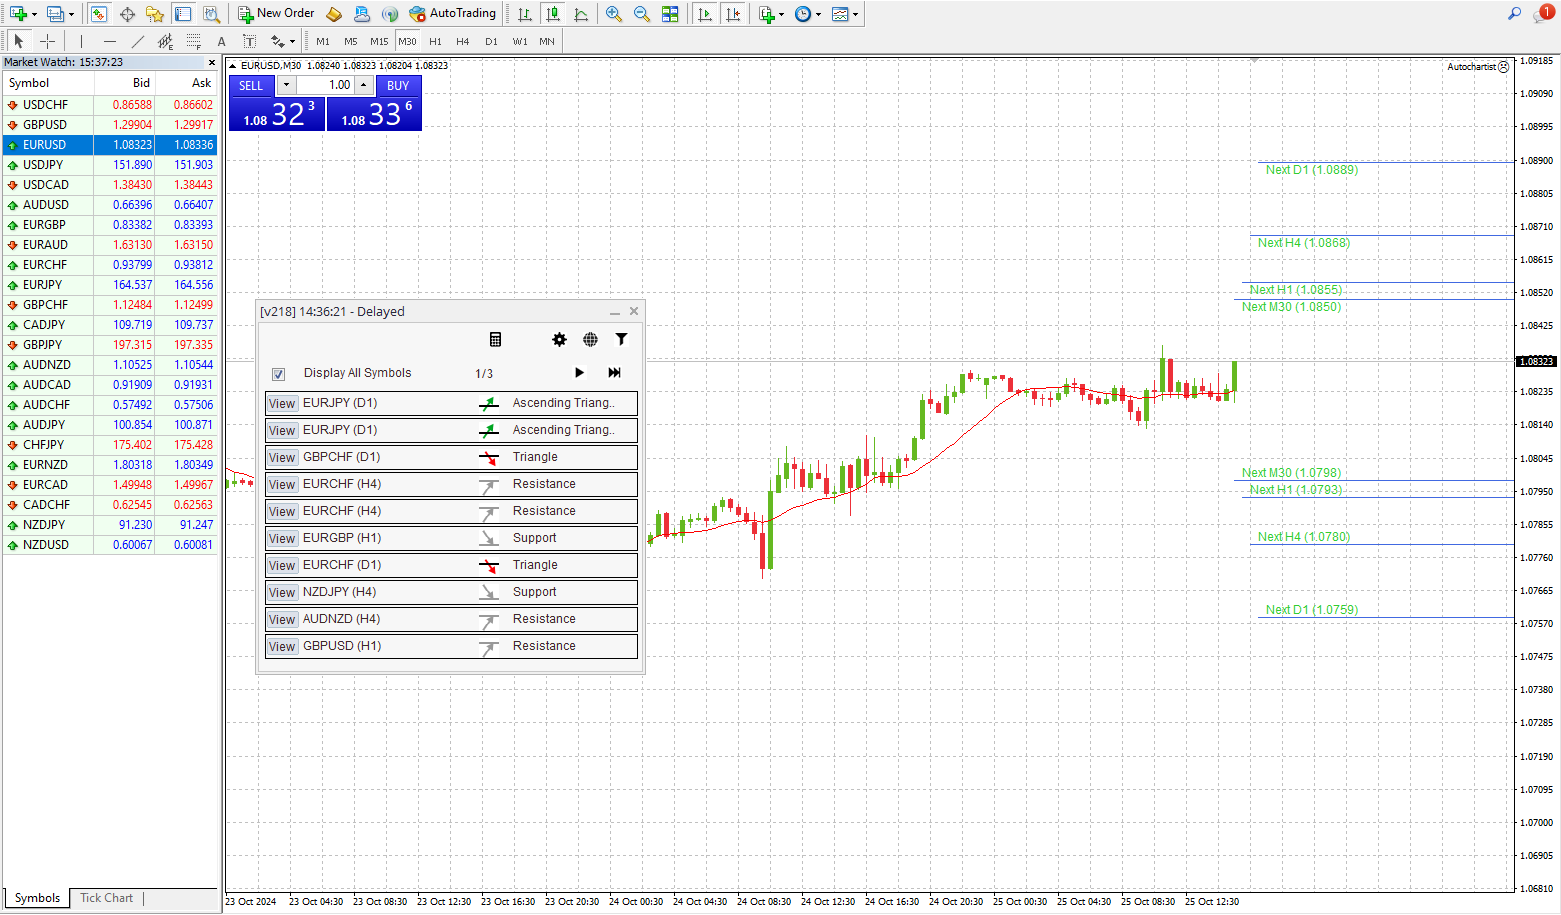
The Autochartist Market opportunity scanner is the perfect trading companion. Whether you are a trend trader or a swing trader, Autochartist’s approaching and breakthrough patterns will show you where the action is. If you’re interested in a particular timeframe or pattern type, use the Filters option to customise the market activity you see.


Getting started

Access the powerful market scanner, Autochartist

Risk Calculator

Professional traders know the importance of risk management, considering the amount of return they are getting compared to the risk on each trade. The Autochartist Risk Calculator can help you maintain an appropriate risk level across all of your trades.

The Autochartist Risk Calculator can help you maintain an appropriate risk level across all of your trades.

Autochartist in cTrader

Autochartist within the cTrader platform allows traders to simply be presented with available Autochartist trading opportunities. cTrader zones in on what matters most to you: comprehensive content on your favourite instruments.
Volatility analysis

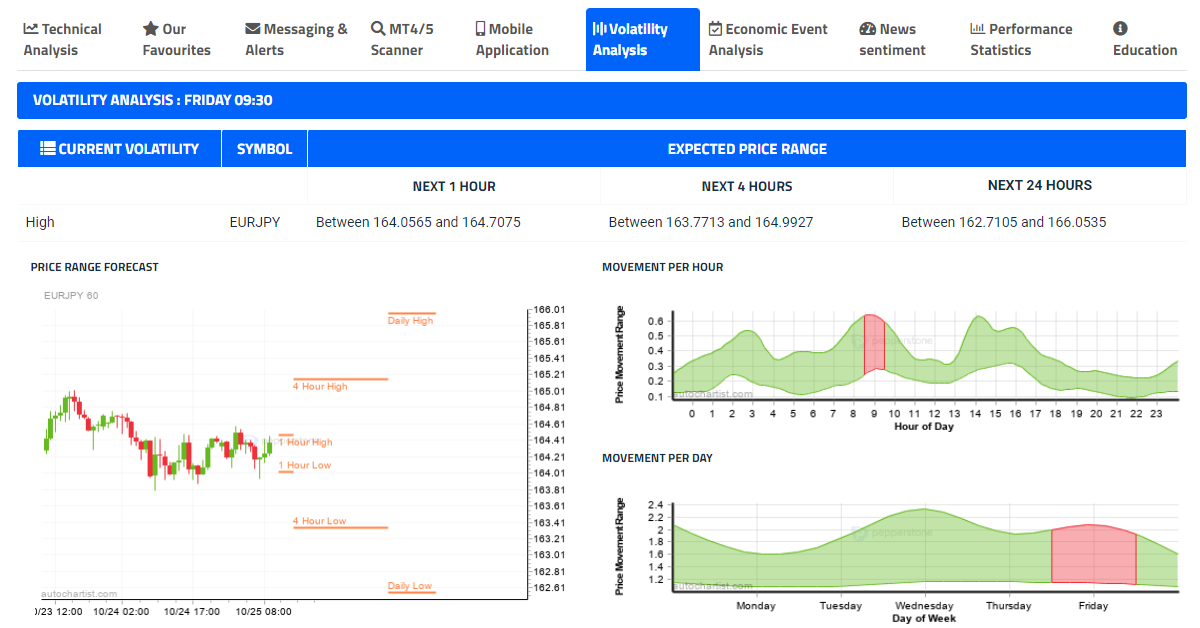
Use Volatility Analysis to help you set appropriate take profit and stop-loss levels based on expected market volatility. Plus, you'll discover information like the time of day at which markets are most volatile and how to select instruments which fall within acceptable risk parameters.

Autochartist Volatility analysis


Research Portal/Web App

Whether you are new to trading or a seasoned professional, you’ll find Autochartist analysis and tools for traders like you. No matter your style or experience level, we have everything you need for a more informed trading strategy right here in one convenient place. Research portal high-level overview.

Autochartist Research Portal/Web App


Our Favourites Filter

  • A curated collection of trade setups with most likely high- performance.
  • Autochartist uses a 6-month period of historical performance data combined with key trading factors to provide the best trade setups.
  • Calculated probabilities considering the trading symbol, time of identification, and pattern type.

A curated collection of trade setups with most likely high- performance


Autochartist Mobile App

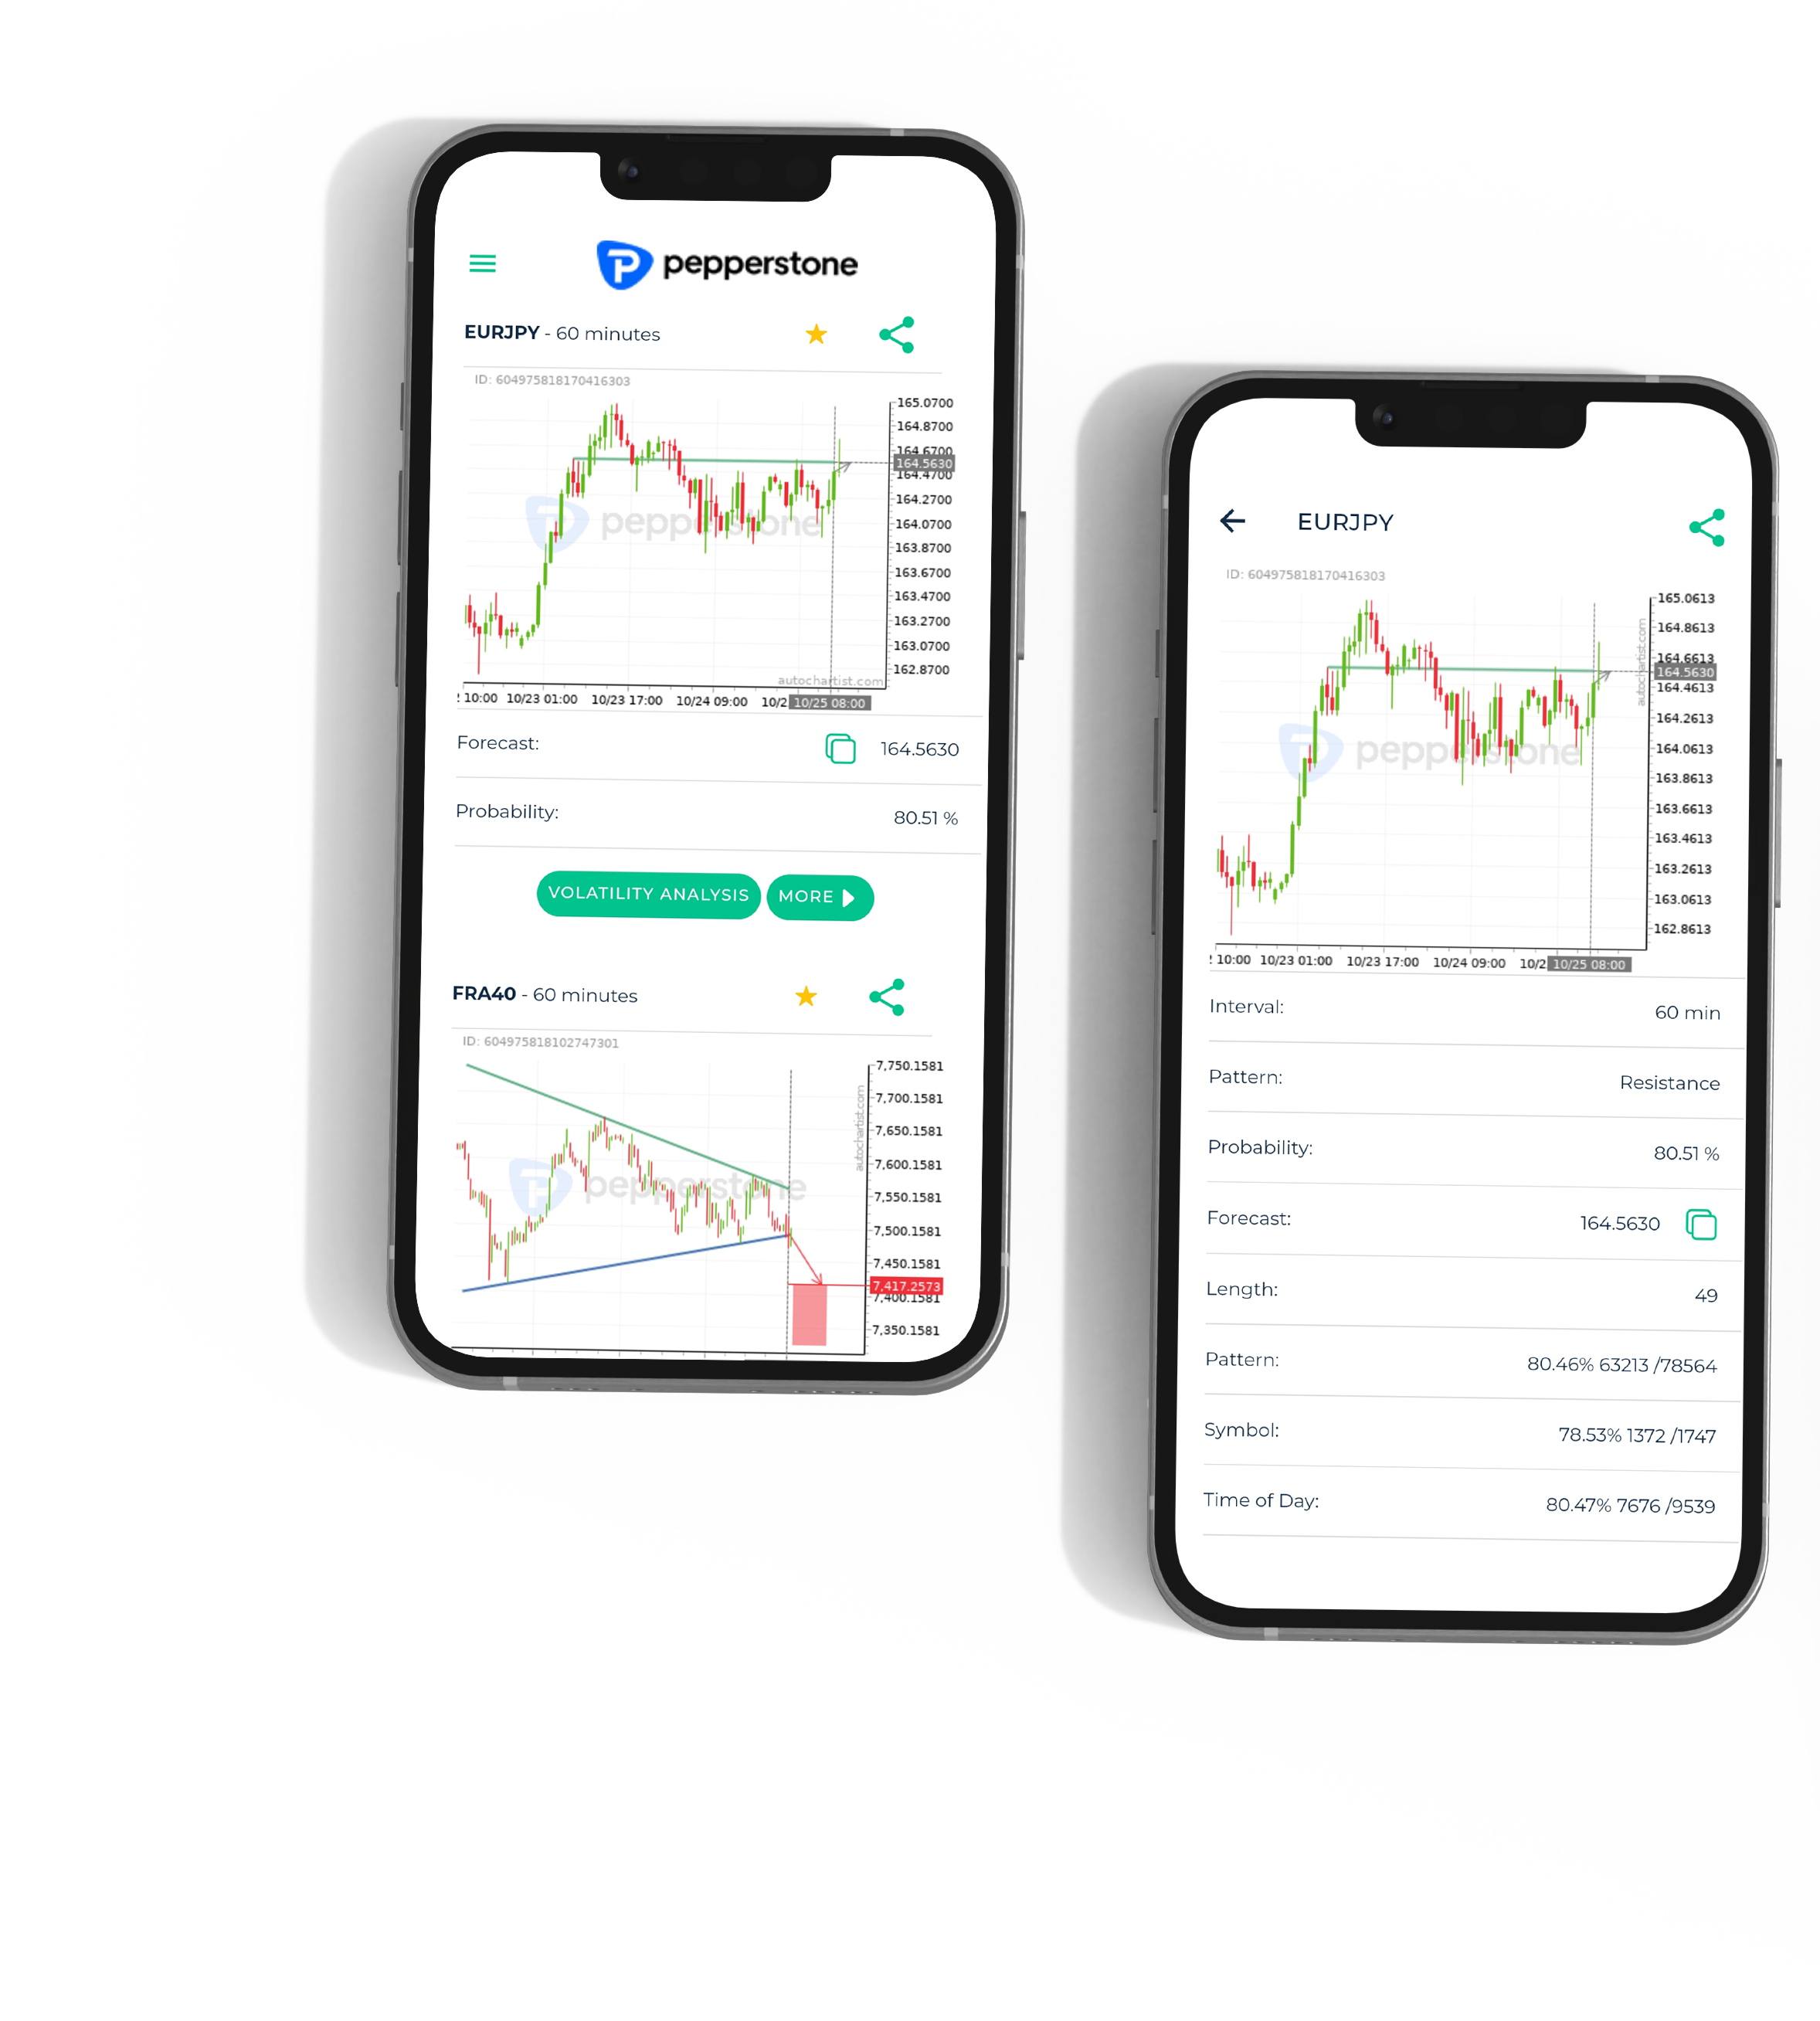
The Autochartist mobile application presents traders with trading options that are evaluated against past performance with respect to the pattern type, instrument and time of day it was identified. Traders are notified by push notification when a new trade setup is found.

The Autochartist Mobile App is available for iPhone/iPad as well as Android devices.

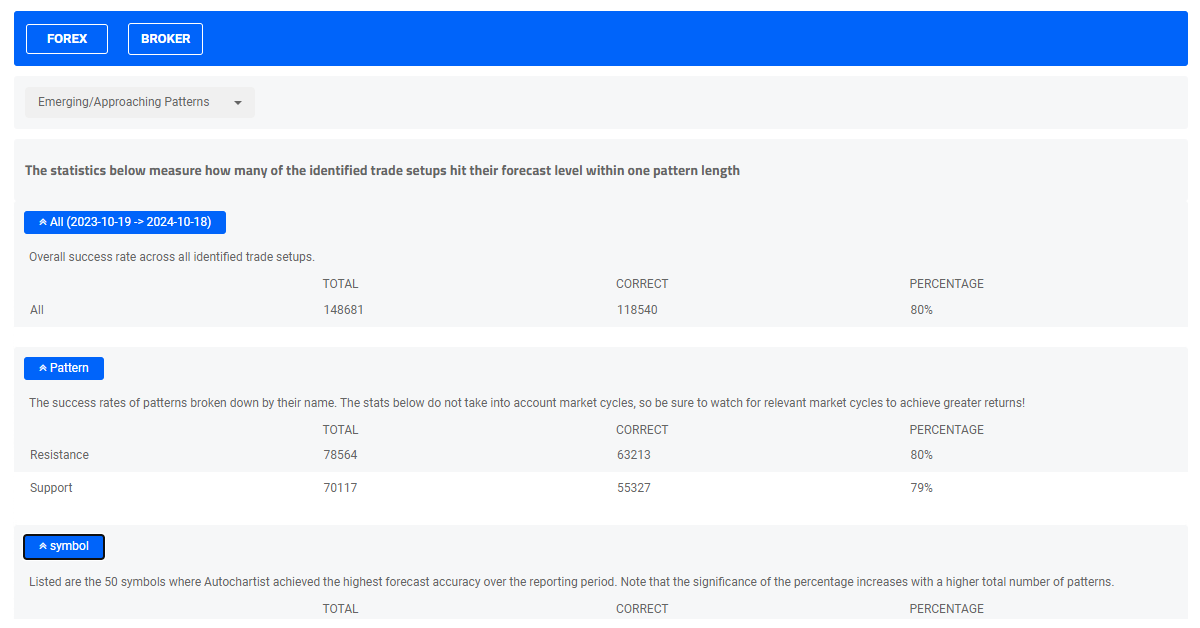
Performance_Statistic_-_Forex_Breakout_Pattern.jpg
Autochartist Mobile App. The Autochartist mobile application presents traders with trading options that are evaluated against past performance with respect to the pattern type, instrument and time of day it was identified.