- English
Will Friday's US Jobs number jolt markets back into action?
.jpg?height=93&quality=30)
Reuters and Bloomberg consensus estimates are expecting 650k and 700k respectively. This is a crucial jobs number after the April Fed minutes raised the specter of an upcoming discussion about tapering, with the momentum on this topic kept alive by FOMC members like Clarida and Daly. Although the US has its own idiosyncratic conditions for policy normalization, it does seem like what others are doing has maybe affected the psyche of the Fed. Norges Bank (Norway), Bank of Canada, Bank of England and the Royal Bank of New Zealand have all turned relatively hawkish which could be affecting the way the Fed thinks about their own policy. This is a really interesting dynamic as the US has typically led G10 FX nations out of recessions in normalising policy.
This jobs number if strong will make April’s look like a once-off anomaly. It will also be key in shaping the market’s tapering and rate hike expectations ahead of the June 16 FOMC meeting. The market has been rangebound recently, searching for its next catalyst to breathe some life back into a whole host of assets. The answer to whether this is a vol event is not just if it beats/misses consensus, but the extent too and how the market is positioned. Indicators such as declining initial jobless claims and restaurant reservations surging (more restaurant hires) are encouraging with many offering a belief that the risk, or higher probability outcome, lies in a number north of 700k jobs. I think to move the dial and see a reaction in financial markets we’ll need a print of at least 850k+ as well as an upward revision in April’s number. In this scenario, USD shorts and JPY would struggle. While in equity land I'd be looking at financials to catch a bid, with names like JPM a solid place to be long. Alternatively, a weak jobs print would keep pressure on the USD, and see liquidity beneficiaries, like Gold, Crypto and Tech outperform. Another important data point to keep an eye on besides the headline figure is average hourly earnings which would feed into inflation fears. The next US inflation report is out on June 10.
Bond traders will be wary as a robust NFP print could reignite a move higher in yields. To me the risks for a repricing higher in yields seems asymmetric. A disappointment shouldn’t push yields lower by much, but a solid beat could see quite a big sell-off in bond land. The US 5yr Treasury is my preferred guide on how the market views Fed policy, it is currently oscillating between 75bp (or 0.75%) and 87bp. We can look at this as a guide for the USD – if the yield heads higher I’d be taking a far more constructive view on the USD and vice versa. Real yields also seem to be ticking higher, this event could continue that trend. If equity markets sell-off on higher yields we could also see a mild risk-off bid for the dollar. Lastly, net specs short positioning is also quite sizeable on the greenback.
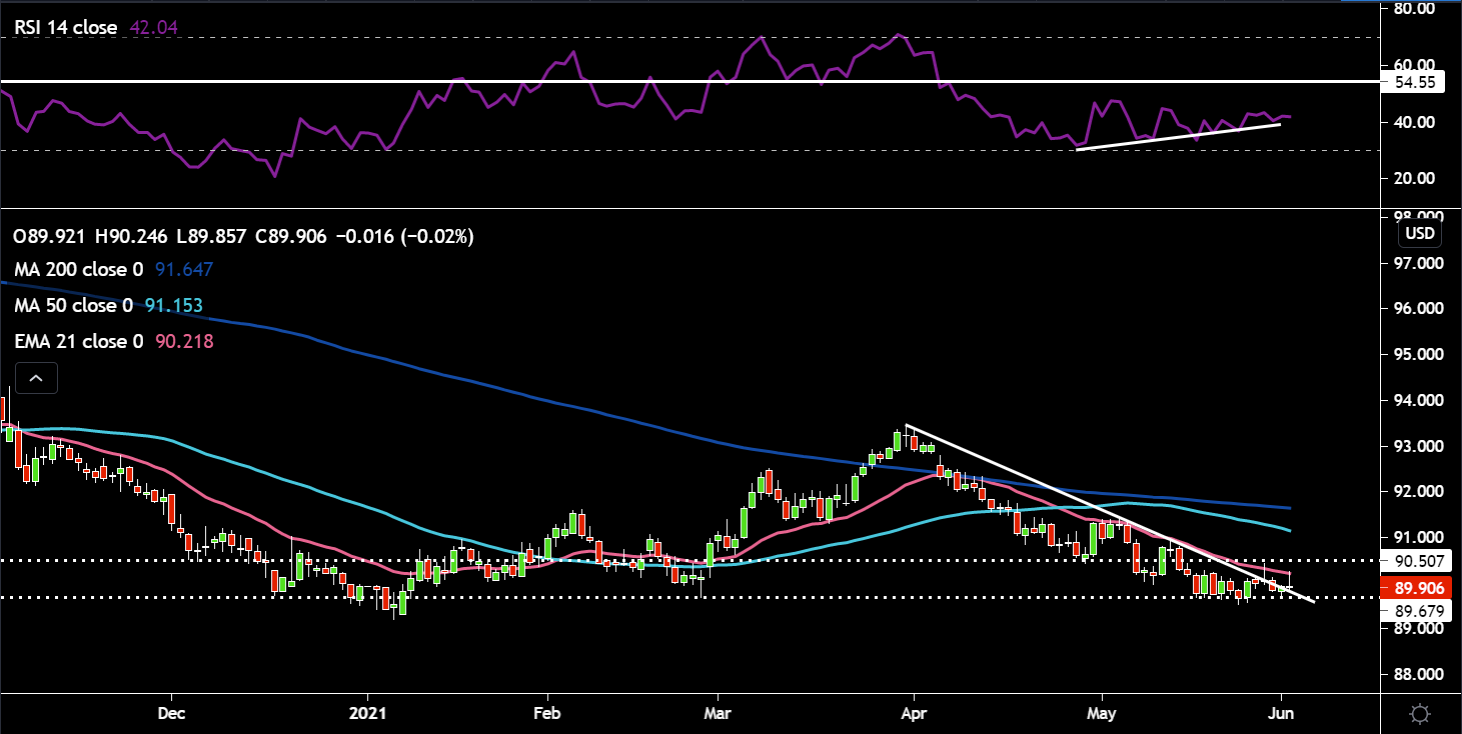
DXY has been bouncing around the downtrend line in place from April’s high, trying to decisively break it to the upside. Candle highs have been tagging the 21-day EMA which is acting as dynamic resistance around the 90.2-4 zone. This moving average needs to be cleared comfortably before bulls can begin to get excited again. The divergence appearing between price and the RSI was making a move higher more likely as selling momentum weakened. That was combined with solid support around 89.7. The obvious price target to the upside would be 90.5 where there is some former support which could now provide resistance.
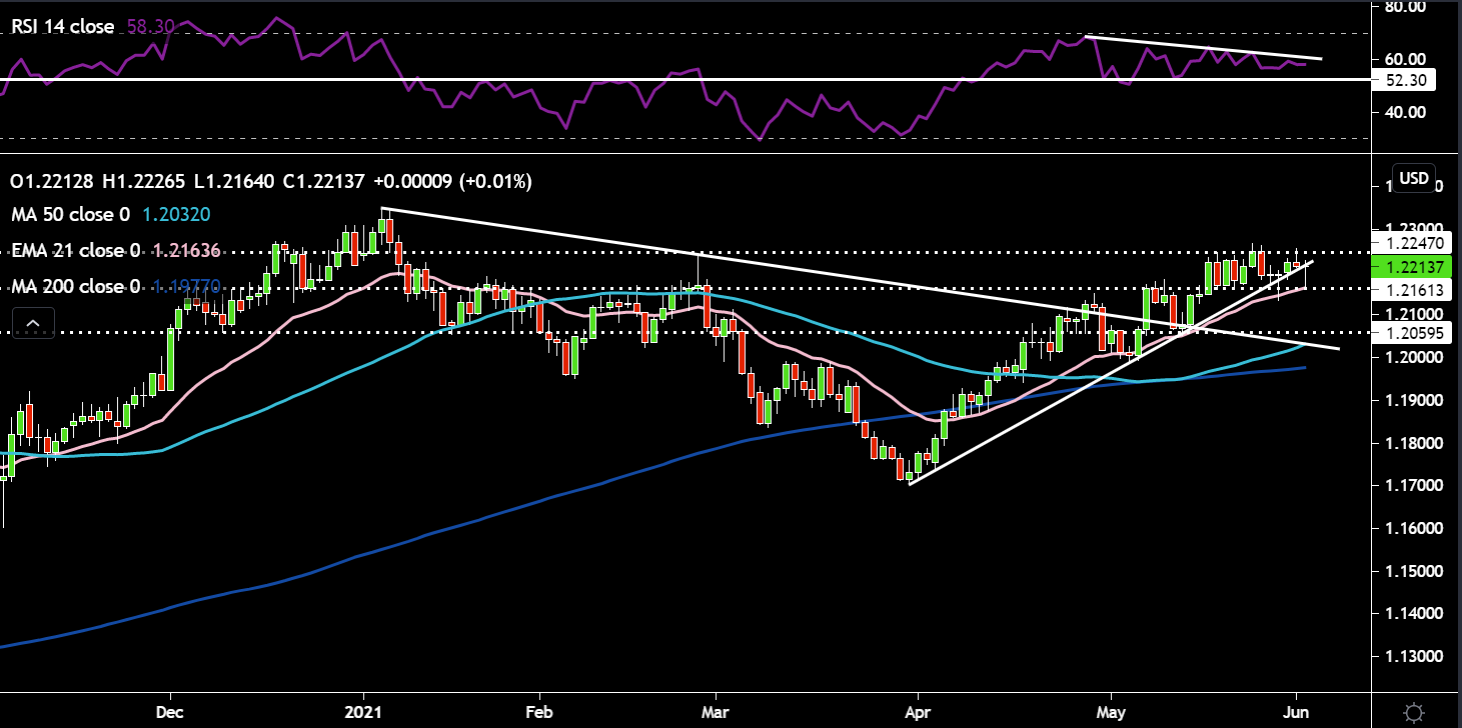
EURUSD has been under pressure since the end of May. The candle low broke the range low/horizontal support as well as the uptrend line around 1.216 last week Friday. Price has rebounded slightly off the 21-day EMA. The 1.224 level is still proving too difficult for EURUSD to overcome. The divergence on the RSI as price made higher highs and the RSI made lower highs seems to have worked as a bearish omen. The RSI is also near to the key 52 support level which has contained previous price dips. The target to the downside would be 1.21 and then 1.205 support further down.
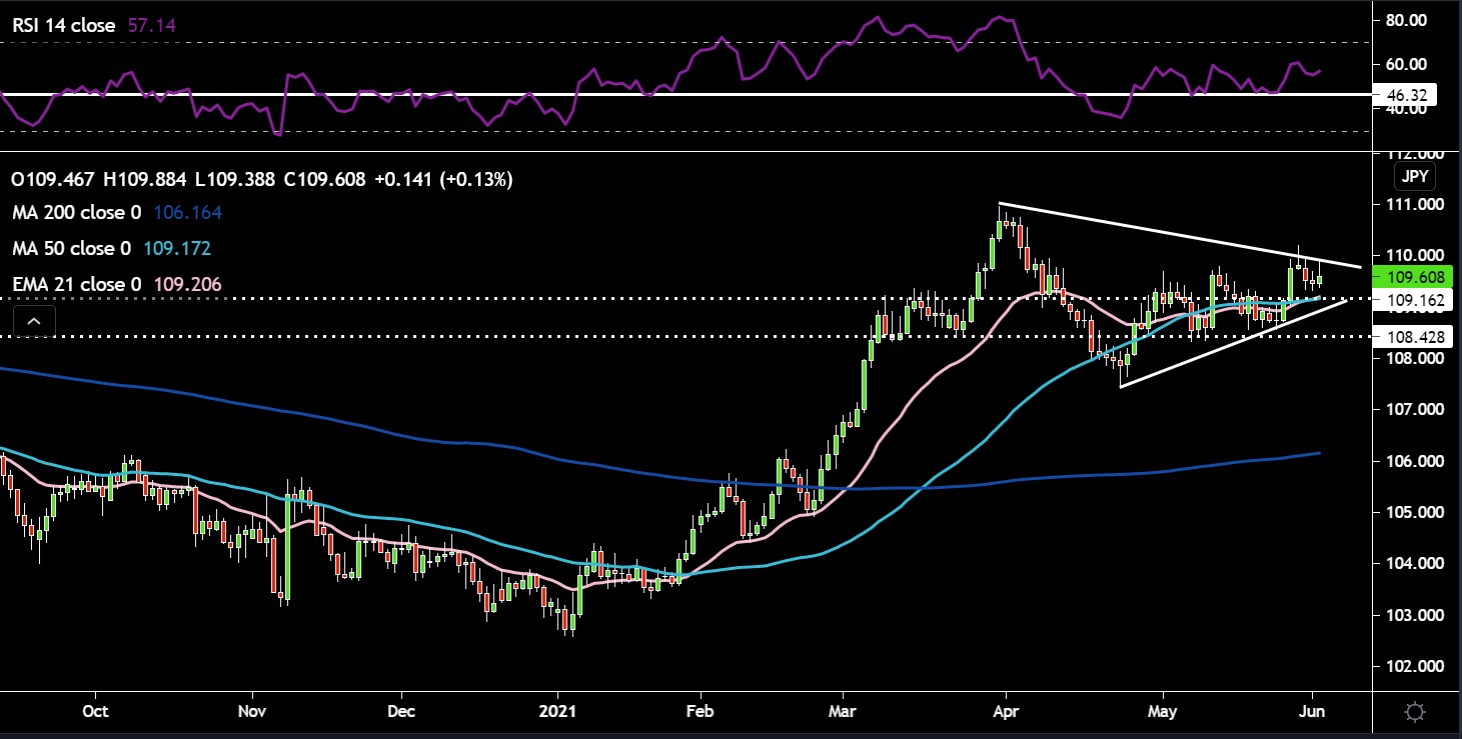
USDJPY has pushed higher over the last 2 weeks and is now above the 2017 downtrend line as well as moving into the 110 region briefly. The RSI is on a slow grind higher and still has some room before it could be considered overbought. There seems to be a triangle structure forming too as we get lower highs and higher lows with a breakout in one direction soon to happen. This cross will continue to take direction from where US yields move to. The 21-day EMA is crossing above the 50-day SMA (bullish short term). The next price target would be the late March highs of 111.
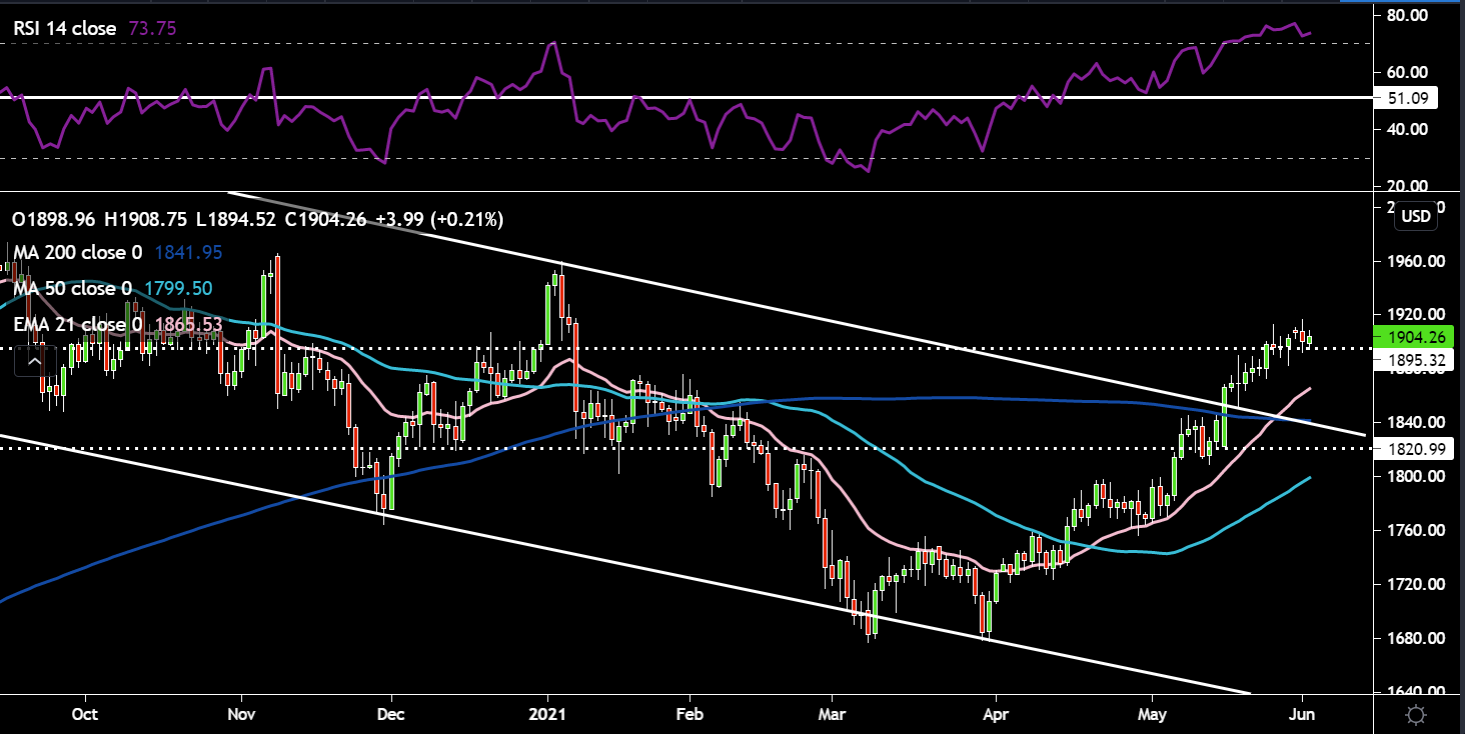
Price has breached the $1900 level and has remained above this key level for now. The candles with the long wicks tell me sellers are consistently coming in to push price lower. The RSI momentum indicator is deep in overbought territory and has edged down of late, but has turned up today. If the dollar and real yields continues to move higher we could see a re-test of the 200-day SMA and trend line around $1840/50. Gold has run awfully hard over the past 2 months, we could now see profit taking ramped up. On the upside $1915 looks to be a good first initial target.
Related articles

Ready to trade?
It's quick and easy to get started. Apply in minutes with our simple application process.
The material provided here has not been prepared in accordance with legal requirements designed to promote the independence of investment research and as such is considered to be a marketing communication. Whilst it is not subject to any prohibition on dealing ahead of the dissemination of investment research we will not seek to take any advantage before providing it to our clients.
Pepperstone doesn’t represent that the material provided here is accurate, current or complete, and therefore shouldn’t be relied upon as such. The information, whether from a third party or not, isn’t to be considered as a recommendation; or an offer to buy or sell; or the solicitation of an offer to buy or sell any security, financial product or instrument; or to participate in any particular trading strategy. It does not take into account readers’ financial situation or investment objectives. We advise any readers of this content to seek their own advice. Without the approval of Pepperstone, reproduction or redistribution of this information isn’t permitted.