A complete guide to reversal trading
Reversal trading lets you find chances at key turning points, often before the broader market picks up on it, unlike continuation strategies, which depend on riding current trends.
Learning the art of reversal trading can help you approach markets more confidently, whether trading stocks, forex, cryptocurrency, or commodities.
This article will thoroughly investigate reversal trading from fundamental ideas to sophisticated techniques. We will review the tools and methods used to verify reversals, point out frequent mistakes to avoid, and provide practical guidance to enable you to forecast and act on trend changes confidently. By then, you will have the information and abilities to negotiate reversals properly and include them in your trading toolkit.
What is reversal trading?
Reversal trading is spotting and acting on a trend that is about to reverse direction. Unlike continuation trends, in which prices continue their existing path, reversals indicate substantial shifts in market mood and price behaviour.
Reversal vs continuation trends
- Reversal Trend: This happens when a bullish trend turns bearish or a bearish trend turns bullish. Reversals often signify a larger shift in market dynamics.
- Continuation Trend: This happens when the price consolidates briefly before continuing its current path.
Examples of Reversal Scenarios
- Bullish Reversal: A stock in a downtrend establishes a firm support level and begins to rise, marking the beginning of an upward trend.
- Bearish Reversal: A continuously rising stock encounters a resistance level and begins to decline, indicating a bearish reversal.
Case Study: In November 2021, Tesla (TSLA) exhibited a bearish reversal when it reached $414.50 before exhibiting a combination of overbought RSI and negative market sentiment, causing the stock to drop sharply over the next 4 weeks.

Understanding a reversal trade
A reversal trade is a tactical move traders make to capitalise on a market turning point. This entails determining when a trend has reached its limit and is about to change direction. Reversal trades are frequently used at important junctures, such as when a bullish trend falters or a negative trend finds significant buying support.
How reversal trades fit into broader strategies
Many trading methods rely on reversal trades, which allows traders to:
- Capture Trend Shifts Early: By spotting a reversal, traders can enter a new trend at the best time, maximising profit potential.
- Reduce Risk: Knowing when a trend is about to reverse allows traders to exit positions that could result in losses.
- Improve Trading Efficiency: Rather than maintaining positions during corrections, reversal traders actively reposition to remain on the right side of the market.
Typical market conditions leading to reversals
- Overbought or Oversold
- Reversals occur frequently when the market experiences excessive buying or selling. Technical indicators such as the Relative Strength Index (RSI) can help identify these scenarios.
- Example: A stock with an RSI above 70 is considered overbought and might face a bearish reversal, while an RSI below 30 indicates oversold conditions, signalling a potential bullish reversal.
- Support and Resistance Levels
- Key support and resistance levels are crucial in reversal trading. A reversal is likely when prices fail to breach a resistance level or hold above a support level.
- Example: A bearish reversal might occur when a stock hits a strong resistance level at $150 multiple times without breaking through.
- Volume Spikes
- A sudden increase in trading volume often precedes reversals, indicating heightened activity and market interest in a new direction.
- Divergences
- Divergences between price action and technical indicators like MACD or RSI are strong reversal signals.
- Example: Bearish divergence occurs when the price forms higher highs, but the RSI forms lower highs, signalling a weakening trend.
Example scenarios: Bullish-to-Bearish and Bearish-to-Bullish reversals
Scenario 1: Bullish-to-Bearish Reversal
- Market Setup: A stock has been in a steady uptrend, reaching $200, but fails to break the resistance level.
- Reversal Signal:
-RSI enters overbought territory above 70.
- MACD shows a bearish crossover (the signal line crosses above the MACD line).
- A bearish, engulfing candlestick pattern forms at the resistance level. - Result: The stock starts to decline, confirming a bearish reversal.
Scenario 2: Bearish-to-Bullish Reversal
- Market Setup: The cryptocurrency, Bitcoin, is in a downtrend, trading near $78,000 after weeks of selling pressure.
- Reversal Signal:
- The price forms a double-bottom pattern at $78,000.
- RSI rises from oversold levels below 30.
- A hammer candlestick forms with a significant increase in volume. - Result: Bitcoin breaks above $80,000, beginning a bullish reversal.
Key takeaways for understanding reversal trades
- Market Psychology Drives Reversals: Reversals are common when market participants recognise that the existing trend no longer matches fundamental or technical conditions.
- Confirmation is Needed: Never presume a reversal is happening based on a single cause. Use methods such as RSI, MACD, and candlestick analysis to confirm.
- Risk Management is Essential: Protect yourself against false reversals by using stop-loss orders and adjusting position size.
The rule of reversal
Traders can considerably improve their odds of identifying and capitalising on actual trend reversals by following tried-and-tested methods.
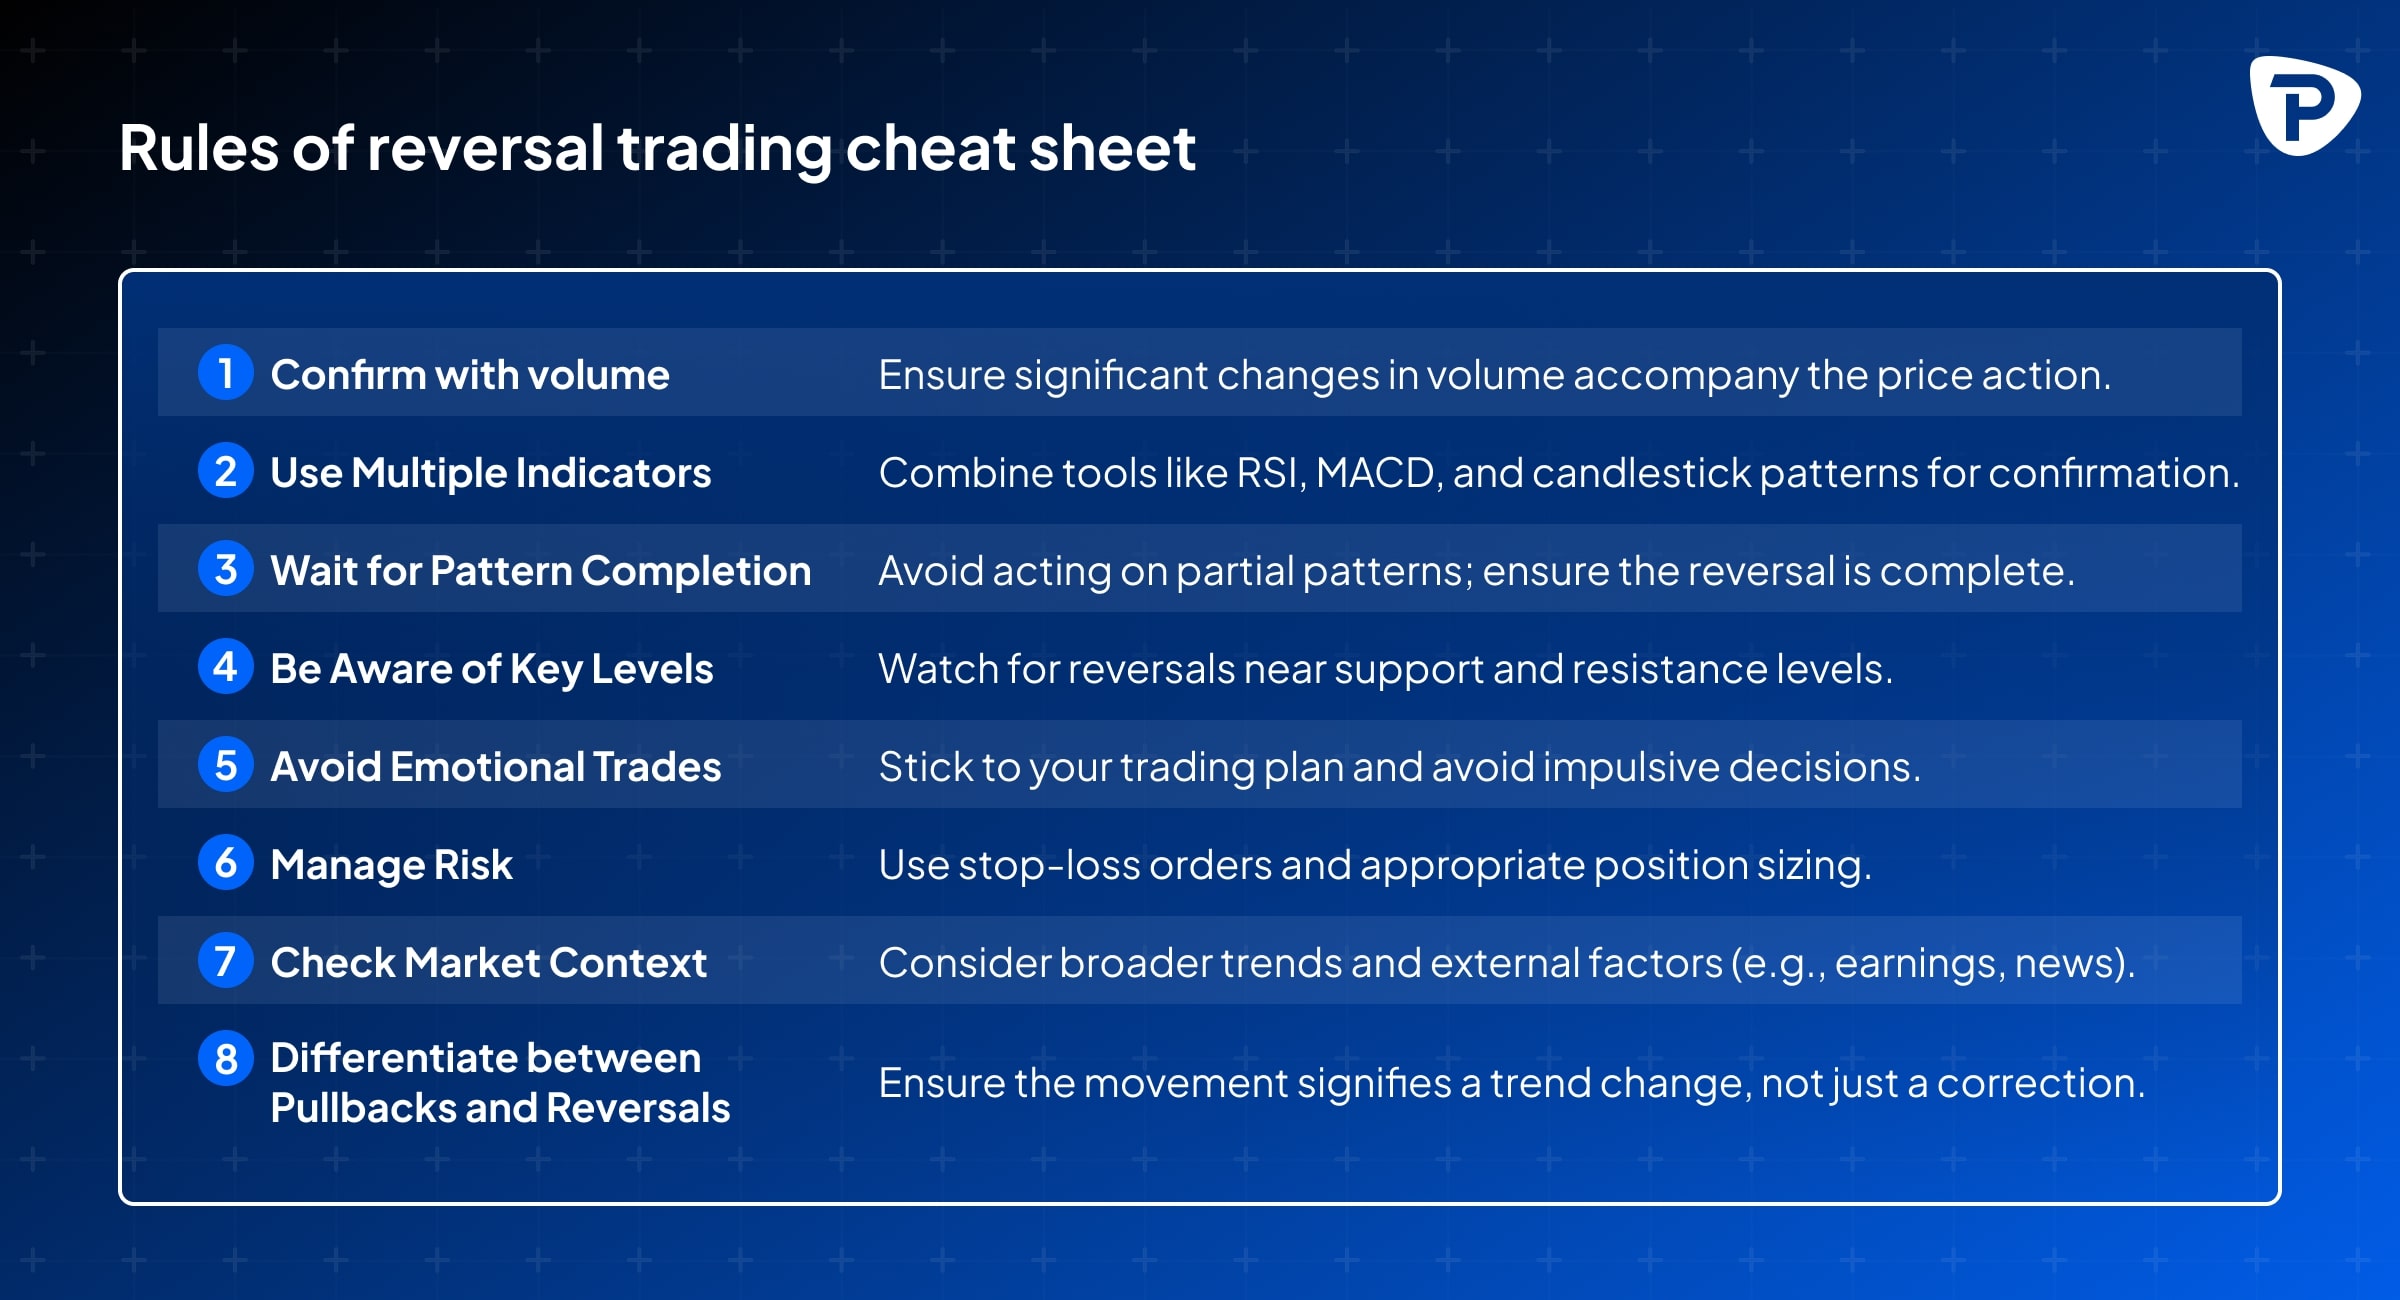
Key principles of reversal trading
1.Volume Confirms Reversals
- Significant changes in trading volume often accompany reversals. High volume during a reversal indicates strong participation and validates the trend shift.
2. Momentum Signals Early Shifts
- Momentum indicators such as Moving Average Convergence Divergence (MACD) and Relative Strength Index (RSI) can detect whether the current trend is fading. For instance:
- RSI Divergence: A bearish divergence happens when prices reach higher highs while the RSI makes lower highs, indicating a possible reversal.
- MACD Crossovers: A bullish crossover happens when the MACD line crosses above the signal line, indicating upward momentum.
3. Price Action Around Critical Levels
- Reversal patterns frequently emerge near significant support and resistance levels. Look for candlestick patterns like this:
- Doji: Signals market indecision and a potential turning point.
- Engulfing Patterns: A bearish engulfing candle implies a bearish reversal, whereas a bullish engulfing candle indicates a bullish reversal.
4. Confirmation is Key
One of the most common reversal trading mistakes is entering a transaction too early. To confirm the reversal, always wait for additional indicators or price action.
Common mistakes
- Mistaking pullbacks for reversals
- A pullback is a temporary price adjustment inside a trend, whereas a reversal represents a complete shift in direction. To distinguish the two, look for sustained momentum shifts and volume confirmation.
- Ignoring market context
- Reversals don’t occur in isolation. To understand the underlying drivers, consider broader market factors, such as economic data releases, sector trends, and geopolitical events.
- Over-reliance on a single indicator
- No single indicator is foolproof. Combining methods such as RSI, MACD, and volume analysis decreases the possibility of erroneous signals.
How to confirm a reversal in trading
Identifying a potential reversal is simply one aspect of the process. To trade reversals effectively, confirmation is required to separate valid trend changes from false signals or pullbacks. This section explores the tools, tactics, and patterns used to confirm reversals, allowing traders to act confidently.
Key tools and techniques for confirming reversals
- Volume as a Confirmation Signal
- Why Volume Matters: Reversals with increasing volumes imply strong market involvement and confirm the trend change.
- Example: In a bullish reversal, more buying volume around a support level indicates increased demand, strengthening the case for a trend change.
2.Momentum Indicators
Momentum indicators help detect early signs of a weakening trend, paving the way for reversal confirmation:
- Relative Strength Index (RSI):
- Overbought/Oversold Levels: RSI above 70 or below 30 suggests potential reversals.
- Divergence: A bearish reversal may occur when prices form higher highs while RSI forms lower highs.
- Moving Average Convergence Divergence (MACD):
- Look for bullish crossovers (the MACD line crossing above the signal line) or bearish crossovers (the line crossing above the MACD line).
- Example: A bullish MACD crossover after a prolonged downtrend indicates a potential reversal.
Moving averages smooth out price data to reveal underlying trends. To confirm reversals, use the approaches described below:
- Crossover Method: When a 10-day moving average crosses above a 50-day moving average, it indicates a positive reversal.
- Price Action vs. Moving Averages: A bullish reversal is established when the price rises above a downward-sloping moving average.
The role of candlestick patterns
Specific candlestick patterns are good indicators of a reversal. These patterns should be combined with volume and momentum indicators for confirmation.
Common Candlestick Patterns:
- Hammer (Bullish Reversal):
- A small body with a long lower shadow suggests rejection of lower prices, frequently occurring at the end of a decline.
- Example: A hammer at a strong support level, accompanied by rising volume, signals a potential bullish reversal.
.jpg)
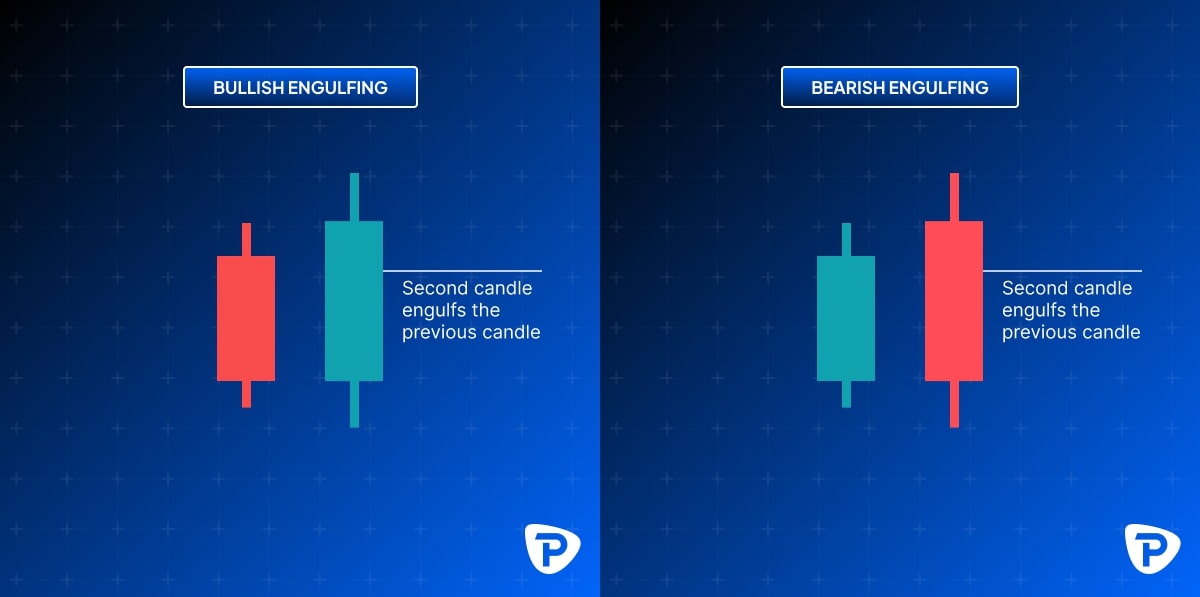
2. Engulfing Patterns:
- Bullish Engulfing: A more prominent green candle completely engulfs the previous red candle, indicating a reversal to the upside.
- Bearish Engulfing: A larger red candle engulfs the prior green candle, signalling downward momentum.
3. Doji (Indecision):
A doji candlestick with a small body and lengthy wicks suggests market indecision. When it forms near support or resistance, it often precedes a reversal.

Case study: bullish reversal confirmation
- Scenario: A stock has been in a prolonged downtrend and approaches a key support level.
- Indicators:
- RSI moves below 30, signalling oversold conditions.
- Volume spikes as buyers come in near a key support level.
- A hammer candlestick forms at the support, signalling a rejection of lower prices.
- Confirmation: The following day, the stock closes higher with continued rising volume, confirming a bullish reversal.
How long can a reversal take?
The duration of a reversal varies considerably based on market conditions, the type of reversal, and the timeframe in which the study is observed. Some reversals occur rapidly, within minutes or hours, while others may take days, weeks, or even months to manifest completely. Understanding the elements driving reversal duration is critical for accurately timing trades.
Factors influencing reversal duration
1. Market Type
- Stock Market: Stock reversals frequently coincide with earnings announcements, economic data releases, or sector-specific news, resulting in strong but sometimes brief reversals.
- Forex Market: Reversals in currency pairs may take longer due to macroeconomic factors such as interest rate fluctuations or geopolitical events.
- Cryptocurrency Market: Crypto reversals are frequently quick and volatile, triggered by sentiment movements, regulatory announcements, or whale activity. (A crypto whale is an entity that holds large amounts of cryptocurrency. These whales own enough cryptocurrency to influence liquidity and prices, and their actions are closely watched.)
2. Timeframe
The timescale employed for analysis has a considerable impact on the perceived duration of a reversal:
- Short-Term (Intraday):
- Reversals in 1-minute to 5-minute charts are common in day trading and can last for minutes to a few hours.
- Example: A 5-minute bullish reversal might occur during a sharp sell-off when a stock finds immediate support.
- Medium-Term (Daily/Weekly):
- Reversals on daily charts tend to last several days or weeks.
- Example: A stock in a prolonged downtrend forms a double-bottom pattern over two weeks before reversing upward.
- Long-Term (Monthly):
- Long-term reversals are typically tied to broader market cycles or economic shifts and may take months to confirm.
- Example: A bearish reversal in a bull market might coincide with rising interest rates, causing a gradual but sustained trend shift.
3. Volume and Market Momentum
- High volume during a reversal can often result in faster confirmation and shorter-duration reversals.
- Low volume may cause delayed reversals because market players take longer to commit to a trend change.
4. Fundamental Triggers
- Major news or events can accelerate the reversal process.
Short-term vs. Long-term reversals
Short-Term Reversals
- Characteristics:
- This often happens during intraday trading sessions.
- Short-term sentiment and technical indicators are driving the market.
- Example: A stock breaks below its support on a 5-minute chart, triggering a bearish reversal.
- Timeframe: A few minutes to hours.
Long-Term Reversals
- Characteristics:
- Significant changes in market sentiment or fundamentals.
- Supported by higher timeframes like weekly or monthly charts.
- Example: A bull market transitions to a bear market due to a sustained economic slowdown.
- Timeframe: Weeks to months.
What is the 5-minute reversal indicator?
The 5-minute reversal indicator is effective for day traders seeking to capitalise on quick trend changes in short timeframes. This indicator, designed for high-frequency trading situations, allows traders to identify potential reversals in as little as five minutes, making it ideal for quick decisions and short-term profits.
How the 5-minute reversal indicator works
The 5-minute reversal indicator combines technical analysis tools such as price action patterns, moving averages, and oscillators to detect momentum and trend direction changes. It identifies key moments where price movement is likely to reverse, offering entry and exit signals.
Key components of the 5-minute reversal indicator
- Price Action Analysis:
- Tracks candlestick patterns that indicate a reversal, such as hammers, engulfing patterns, and doji formations.
- Moving Averages:
- Short-term moving averages (e.g., 5-period and 10-period) detect rapid shifts in trend direction.
- Momentum Oscillators:
- Tools like the Relative Strength Index (RSI) or Stochastic Oscillator highlight overbought or oversold conditions.
Step-by-step guide to using the 5-minute reversal indicator
- Identify the Prevailing Trend:
- Determine whether the market is trending up, down, or consolidating.
- Use higher timeframes (e.g., 15-minute or 1-hour charts) to confirm the overall direction.
- Monitor for Reversal Signals:
- Look for candlestick patterns that indicate indecision or a trend reversal.
- Confirm with Indicators:
- RSI: Check if the RSI is entering overbought (>70) or oversold (<30) territory.
- Moving Average Crossover: A bullish crossover (shorter MA crossing above longer MA) confirms upward momentum.
- Enter the Trade:
- Place a buy or sell order based on the reversal signal.
- Set Stop-Loss and Take-Profit Levels:
- Use nearby support or resistance levels to set stop-losses.
- Define a take-profit target based on the next significant price level.
- Monitor and Adjust:
- Watch the trade and modify stop-loss levels to lock in profits when the price moves in your favour.
Advantages of the 5-minute reversal indicator
- Rapid Signals: Ideal for day traders who prefer quick entries and exits.
- Versatility: Works in numerous markets.
- Simplicity: Combines patterns and commonly used indicators for ease of use.
Limitations of the 5-minute reversal indicator
- False Signals: Rapid timeframes are noise-prone, leading to potential false signals.
- Requires Confirmation: Relying solely on the 5-minute indicator can increase risk; combine it with higher timeframes for validation.
- Time-Intensive: Active monitoring is required to capitalise on quick signals.
Tips for using the 5-minute reversal indicator
- Use High-Liquidity Markets: Apply the indicator in highly liquid assets to reduce slippage and improve execution.
- Combine with Higher Timeframes: To avoid false positives, validate signals with 15-minute or 1-hour charts.
- Practice in Demo Accounts: Test the indicator in a simulated environment before implementing it in live trading.
Conclusion
Reversal trading is a cornerstone of successful trading strategies, offering opportunities to profit from critical market turning points. Whether navigating a bullish-to-bearish shift or profiting from a bearish-to-bullish recovery, mastering the art of reversal trading can significantly enhance your results in financial markets.
Throughout this tutorial, we've covered the fundamentals of reversal trading, the tools and techniques required to validate trend changes, and actionable tactics for various periods. We've also emphasised combining technical indicators such as RSI, MACD, and candlestick patterns with a broader market context to improve accuracy and reduce false signal risk.
TRADER TIP - “Patience, practice, and preparation are the cornerstones of trading success.”
The material provided here has not been prepared in accordance with legal requirements designed to promote the independence of investment research and as such is considered to be a marketing communication. Whilst it is not subject to any prohibition on dealing ahead of the dissemination of investment research we will not seek to take any advantage before providing it to our clients.
Pepperstone doesn’t represent that the material provided here is accurate, current or complete, and therefore shouldn’t be relied upon as such. The information, whether from a third party or not, isn’t to be considered as a recommendation; or an offer to buy or sell; or the solicitation of an offer to buy or sell any security, financial product or instrument; or to participate in any particular trading strategy. It does not take into account readers’ financial situation or investment objectives. We advise any readers of this content to seek their own advice. Without the approval of Pepperstone, reproduction or redistribution of this information isn’t permitted.