- عربي
- English
Will US Q2 earnings mark a low point in the earnings cycle?
US and global equities indices have closed out what was a truly incredible Q2, with price looking remarkably like a re-run of 2009 (see chart 1) – however, with index valuation at the most expensive since the Dot.com era, renewed concerns around a spike in the COVID19 case count, a plateauing of the Fed’s balance sheet expansion and many of the fiscal measures soon to expire, one questions where the balance of risk resides as we navigate a potentially volatile July.
Amid all these macro-focused landmines for traders to navigate we also have US 2Q earnings season due to commence on 14 July, with JP Morgan the first big-name off the rank. With moves in the US500, NAS100 and US30 so influential for FX and commodity markets, don't discount how important this earnings season could be as a driver of broad market sentiment.
Are we due to see an earnings revival?
The two key questions being asked around trading floors:
1. At what stage will the economic recovery feed through to higher consensus earnings estimates, in turn reducing valuation and further boosting the appeal of stocks?
2. Will CEOs and CFOs offer any insights that instil confidence that better times are ahead? This is a view currently portrayed in the charts of copper, crude, and equities, while conversely equities, heavily influenced by Fed policy (chart 2), appear just too optimistic on the economic outlook and could be due to correct through July.
Key considerations for earnings season:
1. While unsurprisingly nearly all US companies refrained from providing earnings guidance in Q1 earnings, we’ve seen emerging evidence of an economic rebound since late April. The Citigroup Economic Surprise Index (chart 3 - this index moves higher when economic data is beating consensus expectations) sits at an all-time high. We’ve also seen stabilisation in the analysts’ earnings assumptions (see chart 4).
2. As we can see in Chart 5, historically earnings estimates have followed the US500 with a lag of about three months. If this holds true once more, we’re eyeing a backdrop where we could be facing a positive upgrade cycle. While statistically it seems more probable to play out from Q3, could this Q2 earnings season ignite a spark?
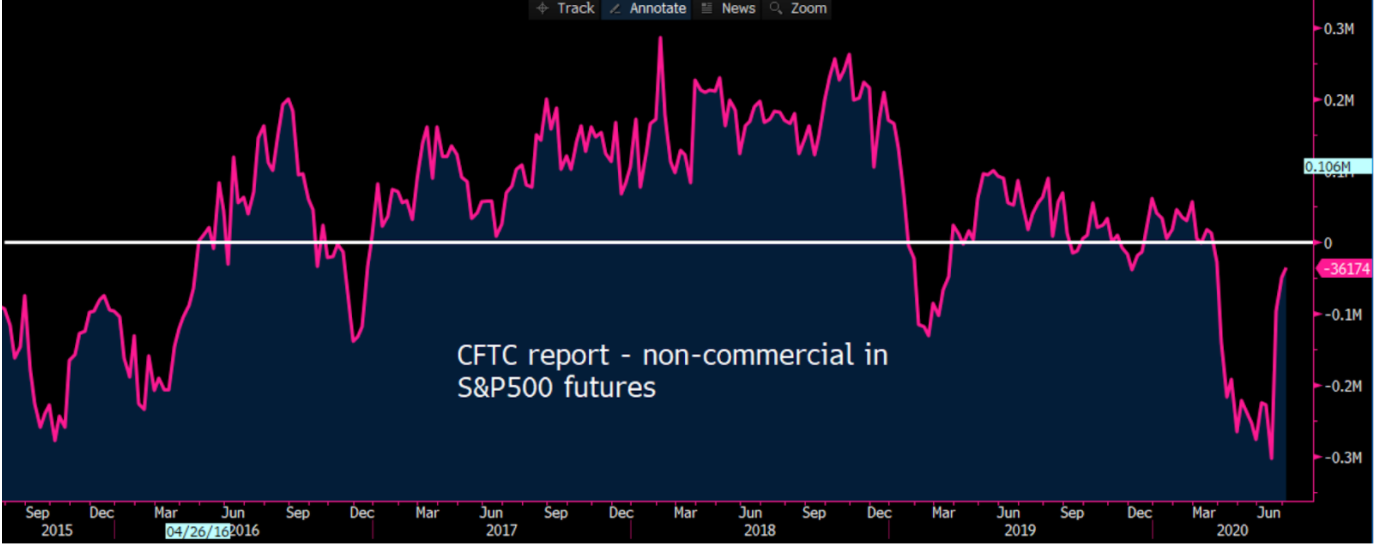
3. After some extensive earnings downgrades through March, the US500 index valuation has blown out, with the price-to-earnings (P/E) multiple moving to 24.5x FY20 and 18.9x FY21 respectively (chart 6) - the highest since June 2000. This alone has been one the main reasons why traders have refrained from buying US equities, and even inspiring short positions, where we can also see hedge funds running a short position in S&P500 futures - where this position has recently been reduced of late (see chart 7).
4. Looking at a traditional valuation is misleading and professional money managers will calculate a valuation by adjusting for the equity risk premium (ERP). This essentially adjusts the expected returns in the equity market for other less risky investments - Consider a scenario (in 12-months) where we see 5% EPS growth, 2-year Treasury yields rising to 20bp and where investment-grade credit spreads remain at current levels. With these variables in play, a quick calculation puts the US500 ‘fair’ equity multiple closer to 21.3x.
One can then argue that the S&P500 is still expensive, but when we consider the low ERP valuation becomes less outrageous. If 5% earnings growth proves to be conservative, and we really are due for an upgrade cycle at a time when the Fed keeps their foot on the pedal and we’re likely to hear more about a vaccine, then one could argue there is still good upside for US equities and that pullbacks are buying opportunities.
5. Interestingly, only 49 companies have pre-announced guidance in the lead up to earnings, with 22 issuing positive EPS guidance and 27 negative guidance – Consider that 27 (negative guidance) is well below the five-year average of 73.1 companies issuing disappointing guidance.
Chart 1: Comparing moves seen from 2008 to 2011 to recent price action. History doesn’t repeat but often rhythms.
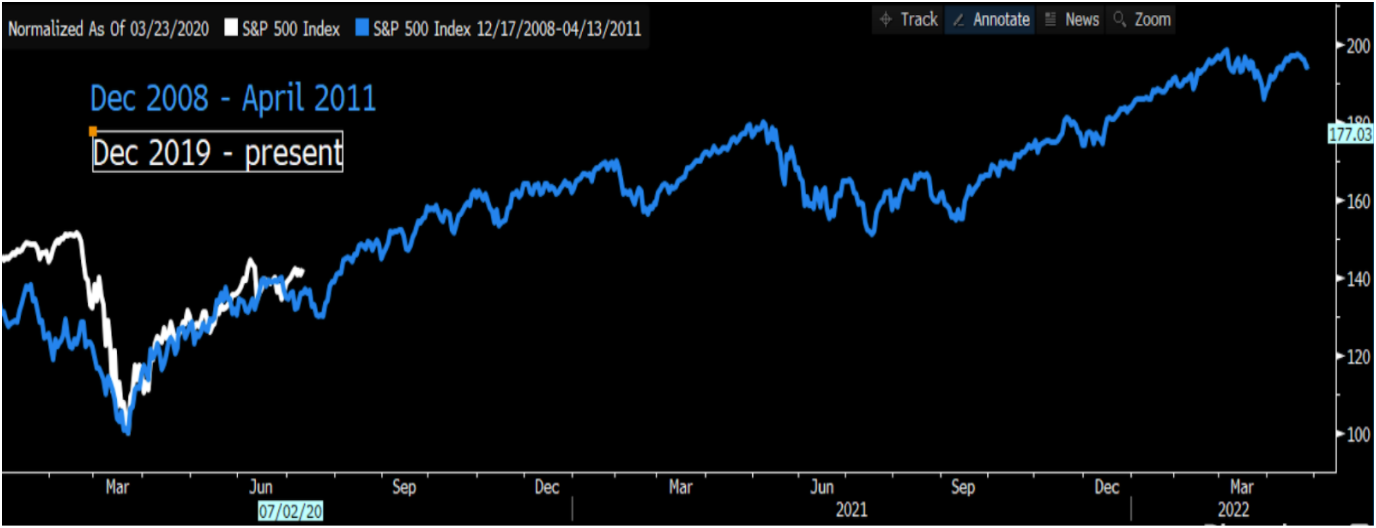
Chart 2: Upper pane - S&P500 (blue) vs the Federal Reserve’s balance sheet (red). Lower pane – M2 money supply
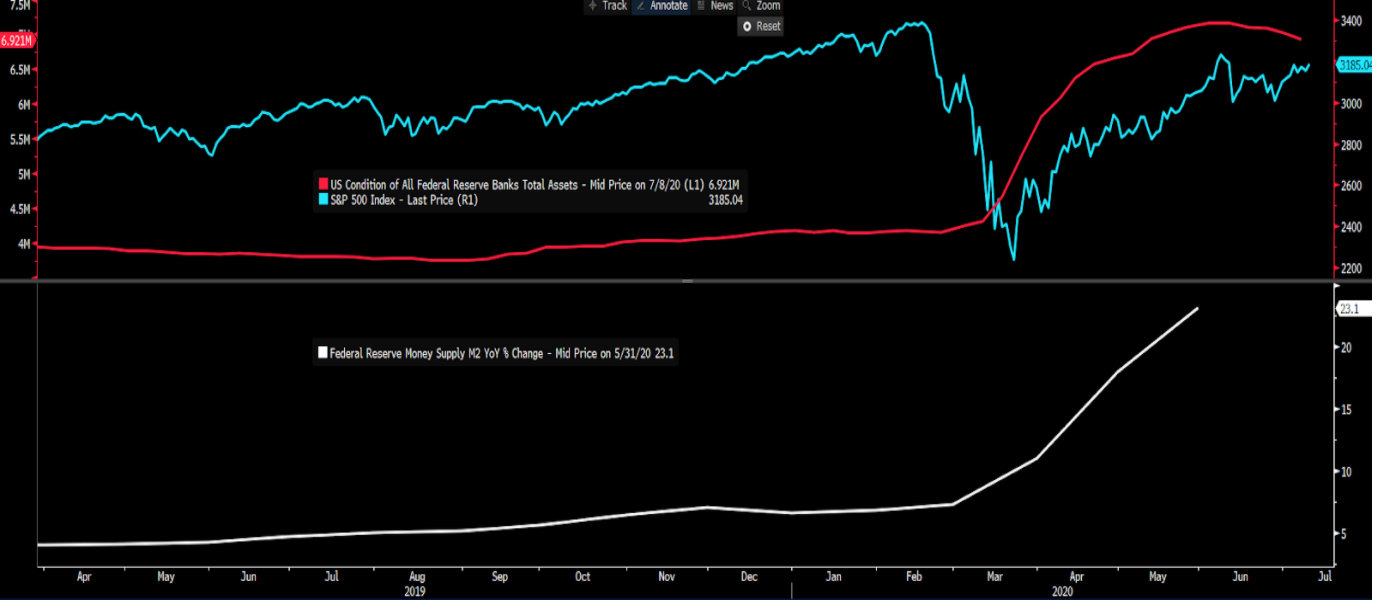
Chart 3: Citigroup Economic Surprise Index – US surprises sit at an all-time high, indicating US economic data has been consistently beating forecasts
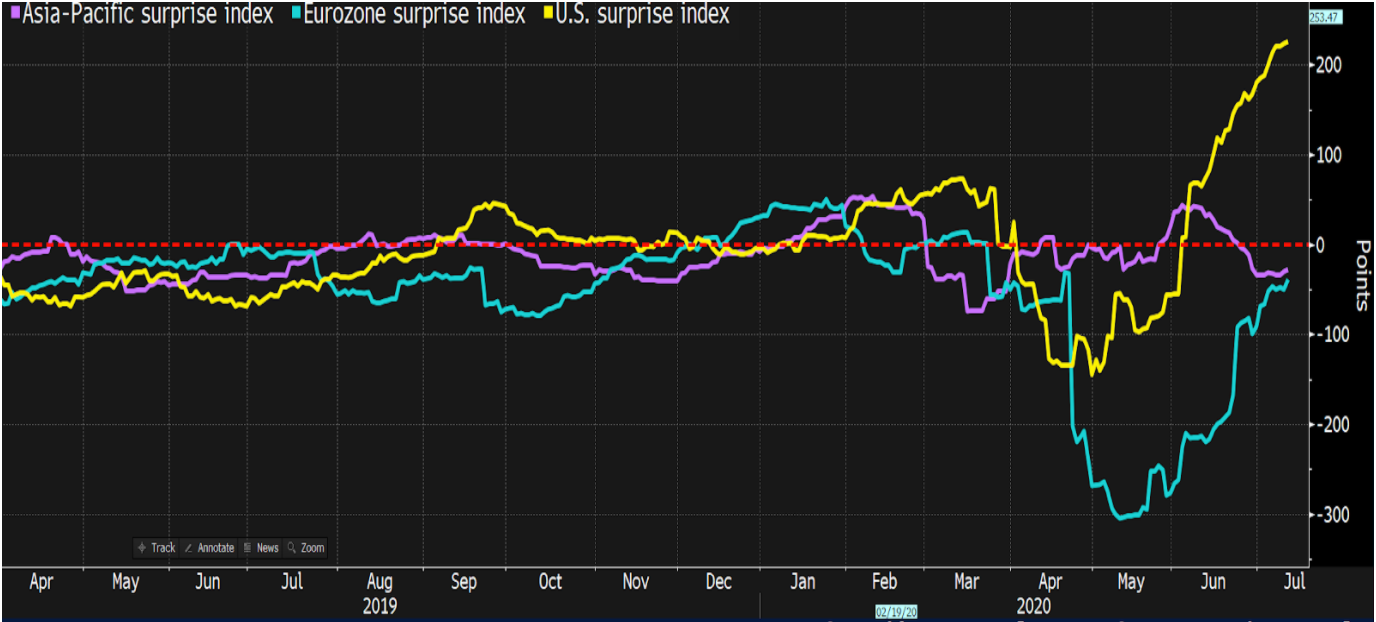
Chart 4: Real-time earnings-per-share (EPS) assumptions for Q220, Q320 and Q420
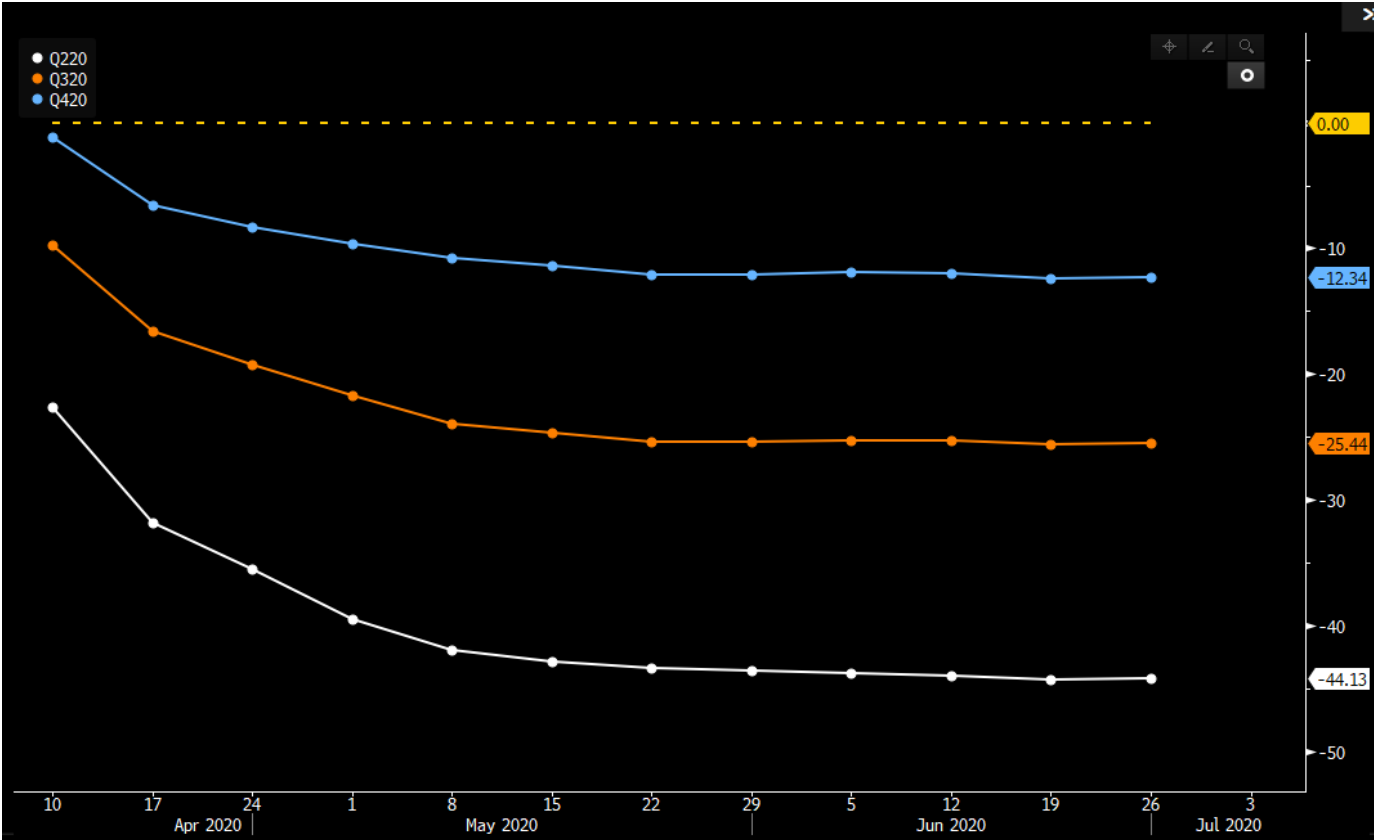
Chart 5: The S&P500 vs consensus 12-month forward EPS estimates – earnings tend to follow the US500, with a lag.
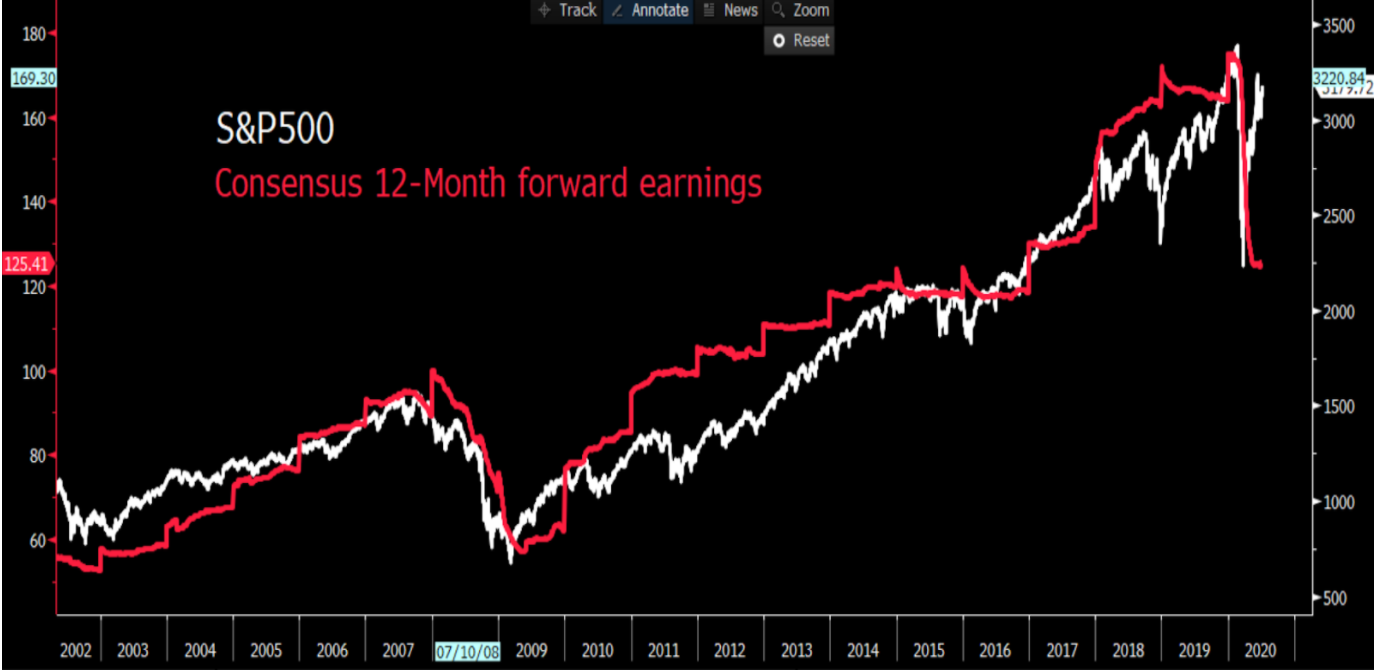
Chart 6: Top pane – FY20 EPS estimates (white), FY21 EPS estimate (orange) Lower pane – FY20 P/E (white), FY21 P/E (orange)
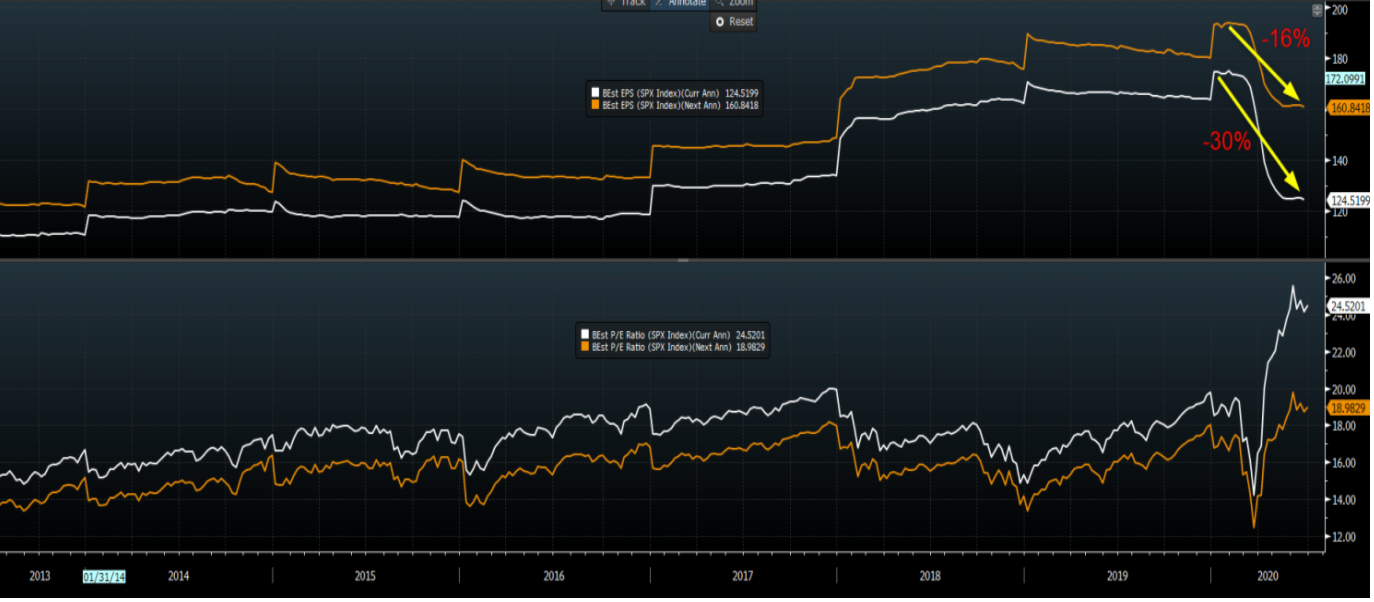
Chart 7: Weekly CFTC data – speculators are surprisingly running a short position in S&P500 futures
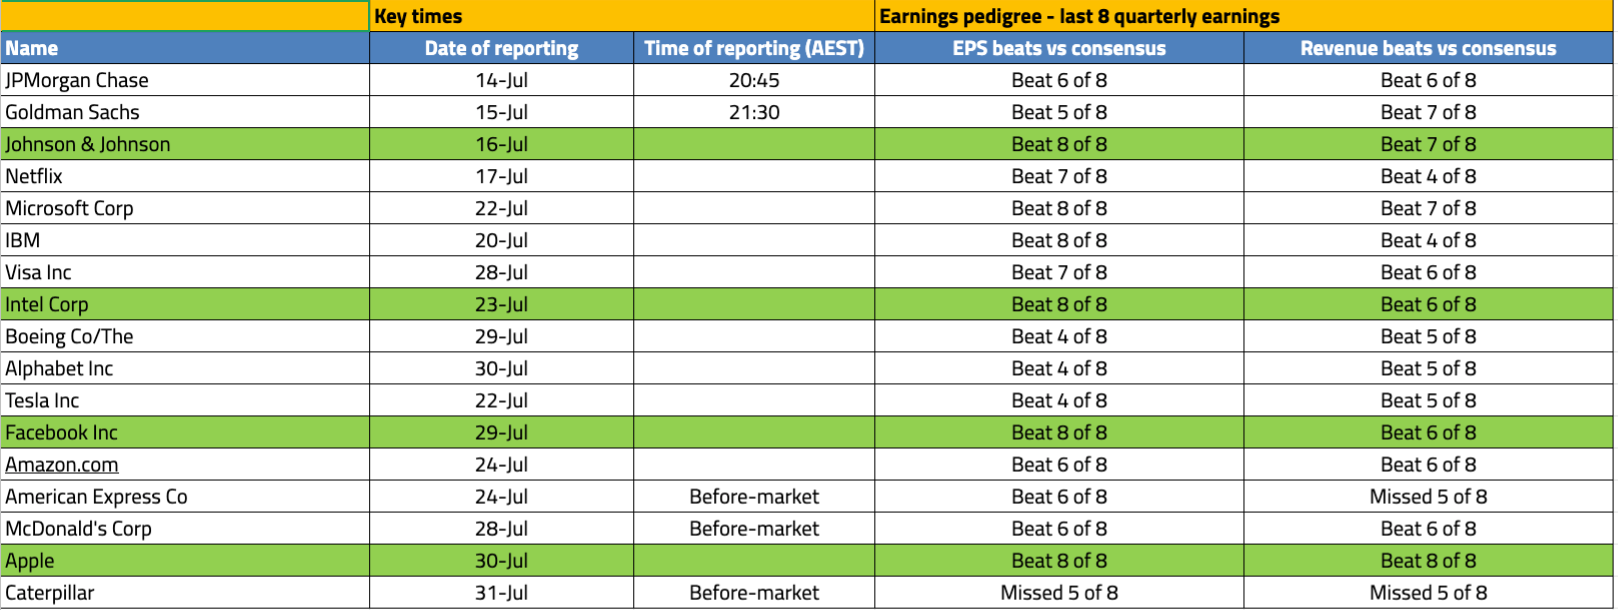
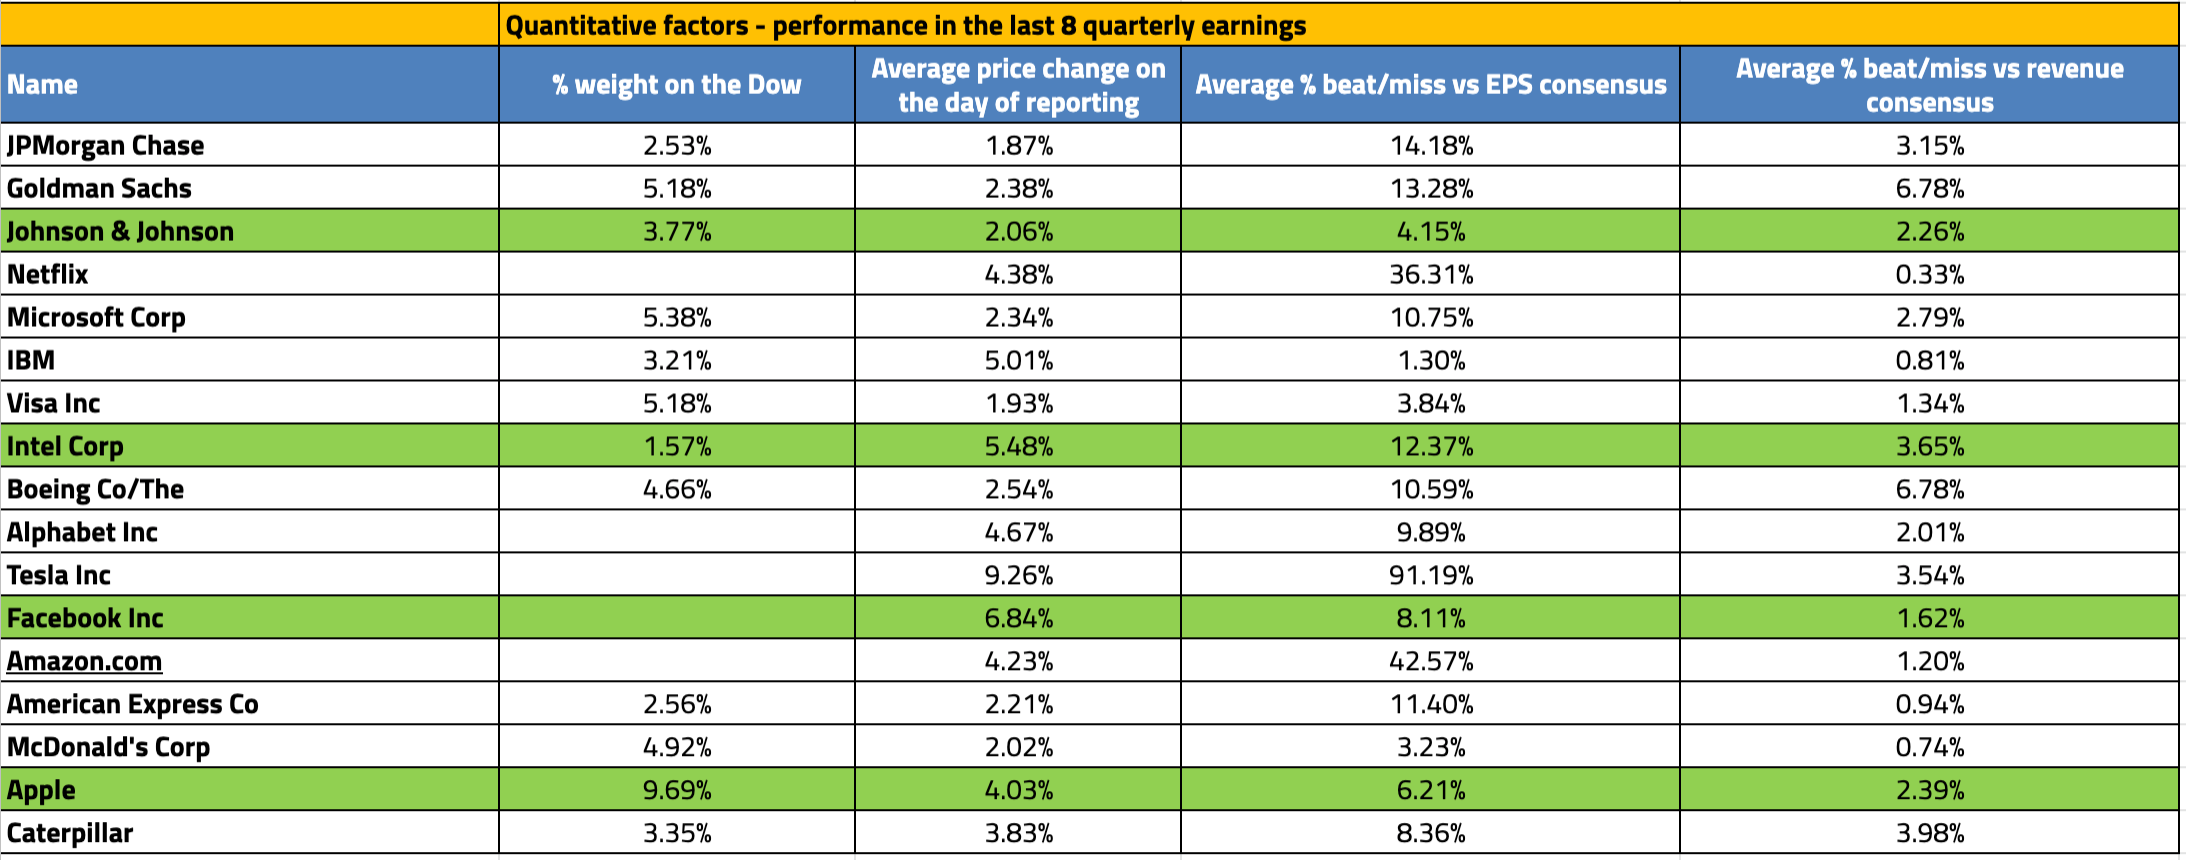
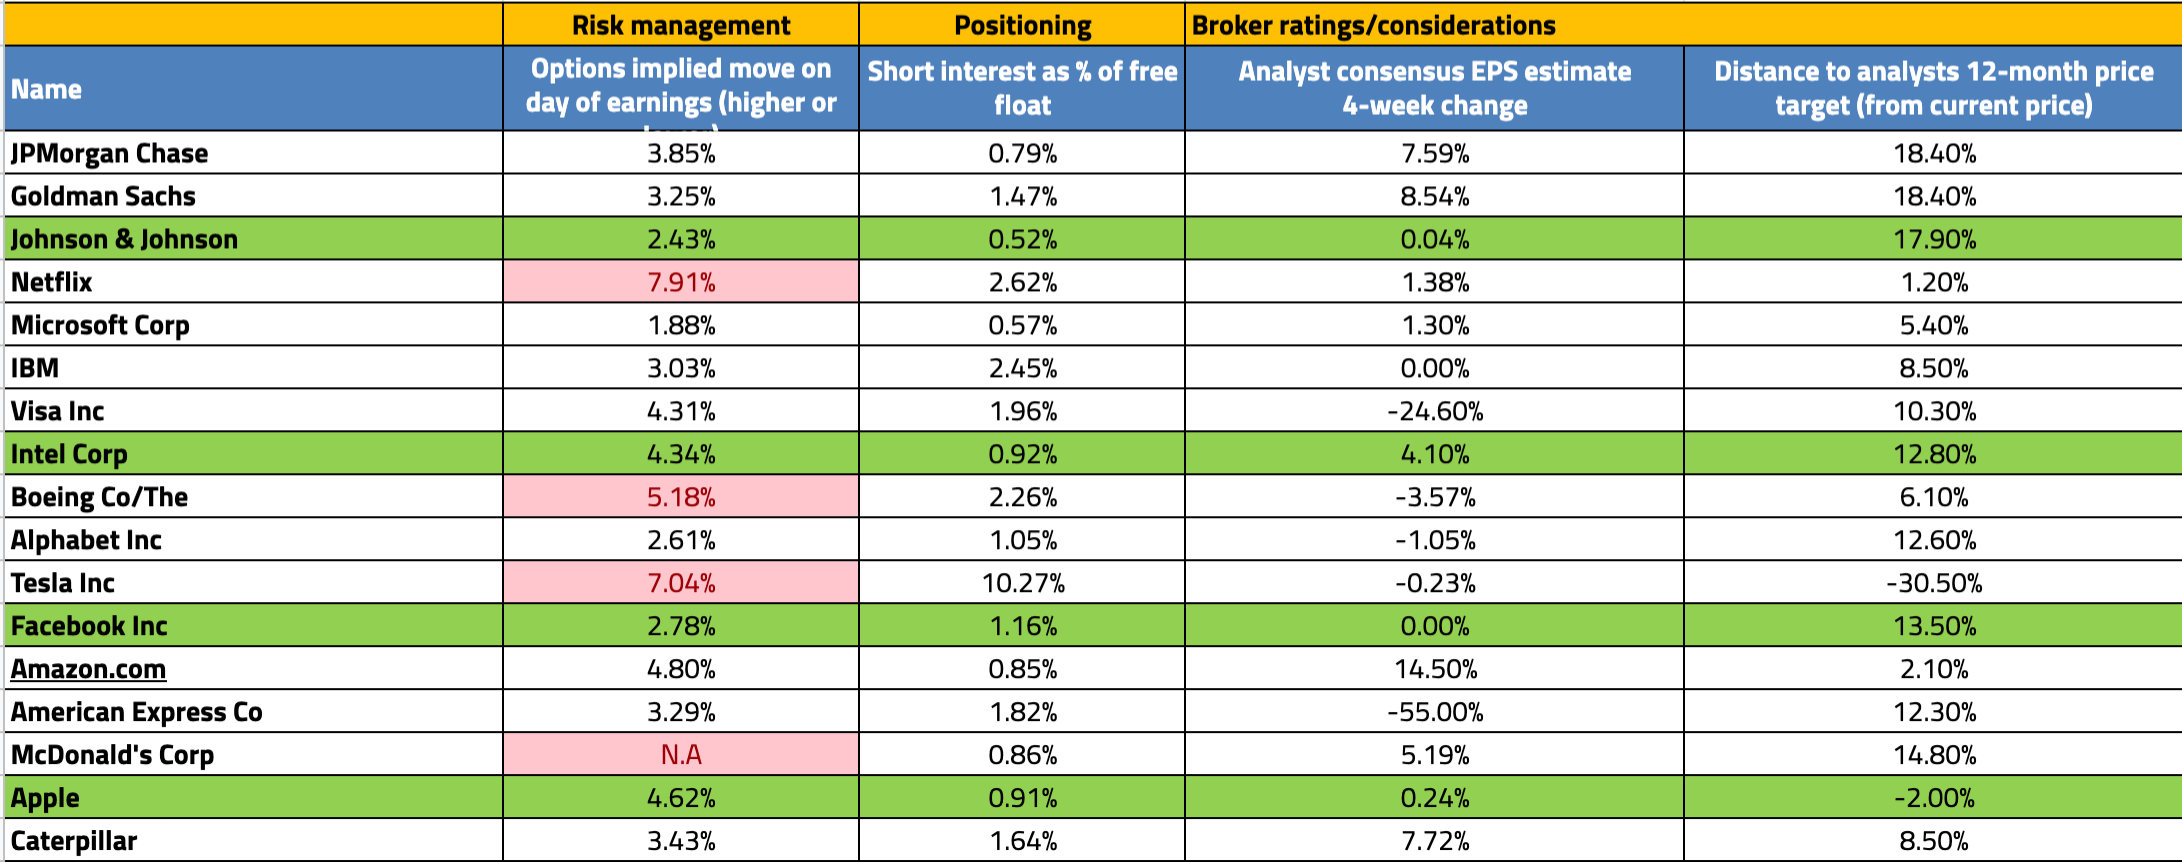
Calendar: what to expect from top US companies
Dates of earnings release, weight % on the Dow and implied moves.
Why trade US earnings season with us?
- Trade a wide range of forex pairs with us on ultra-tight spreads.
- Trade the US30, US500 and NAS100 with fast execution speeds.
- Go long or short on US stocks after hours with our US Share CFDs.
مستعد للتداول؟
يمكنك البدء بسرعة وسهولة. إفتح حساب الآن في دقائق معدودة.
"لم يتم إعداد المواد المقدمة هنا وفقًا للمتطلبات القانونية المصممة لتعزيز استقلالية البحث الاستثماري، وعلى هذا النحو تعتبر بمثابة وسيلة تسويقية. في حين أنه لا يخضع لأي حظر على التعامل قبل نشر أبحاث الاستثمار، فإننا لن نسعى إلى الاستفادة من أي ميزة قبل توفيرها لعملائنا.
بيبرستون لا توضح أن المواد المقدمة هنا دقيقة أو حديثة أو كاملة ، وبالتالي لا ينبغي الاعتماد عليها على هذا النحو. لا يجب اعتبار المعلومات، سواء من طرف ثالث أم لا، على أنها توصية؛ أو عرض للشراء أو البيع؛ أو التماس عرض لشراء أو بيع أي منتج أو أداة مالية؛ أو للمشاركة في أي استراتيجية تداول معينة. لا يأخذ في الاعتبار الوضع المالي للقراء أو أهداف الاستثمار. ننصح القراء لهذا المحتوى بطلب المشورة الخاصة بهم والإستعانة بخبير مالي. بدون موافقة بيبرستون، لا يُسمح بإعادة إنتاج هذه المعلومات أو إعادة توزيعها.
تداول العقود مقابل الفروقات والعملات الأجنبية محفوف بالمخاطر. أنت لا تملك الأصول الأساسية و ليس لديك أي حقوق عليها. إنها ليست مناسبة للجميع ، وإذا كنت عميلاً محترفًا ، فقد يؤدي ذلك إلى خسارة أكبر من استثمارك الأساسي. الأداء السابق في الأسواق المالية ليس مؤشرا على الأداء المستقبلي. يرجى النظر في المخاطر التي تنطوي عليها، والحصول على مشورة مستقلة وقراءة بيان الإفصاح عن المنتج والوثائق القانونية ذات الصلة (المتاحة على موقعنا على الإنترنت www.pepperstone.com) قبل اتخاذ قرار التداول أو الاستثمار.
هذه المعلومات غير مخصصة للتوزيع / الاستخدام من قبل أي شخص في أي بلد يكون فيه هذا التوزيع / الاستخدام مخالفًا للقوانين المحلية."
