Is VAS ASX ETF a good investment?

Some basic information about VAS ASX
The VAS ASX ETF stands for Vanguard Australian Shares Index Exchange Traded Fund. It looks to track the performance of the S&P/ASX300 Index.
It provides a low-cost entry, offering exposure to Australian companies and property trusts.
Vanguard suggests it is suitable for long-term buy and hold investors looking for capital growth with some tax efficient benefits.
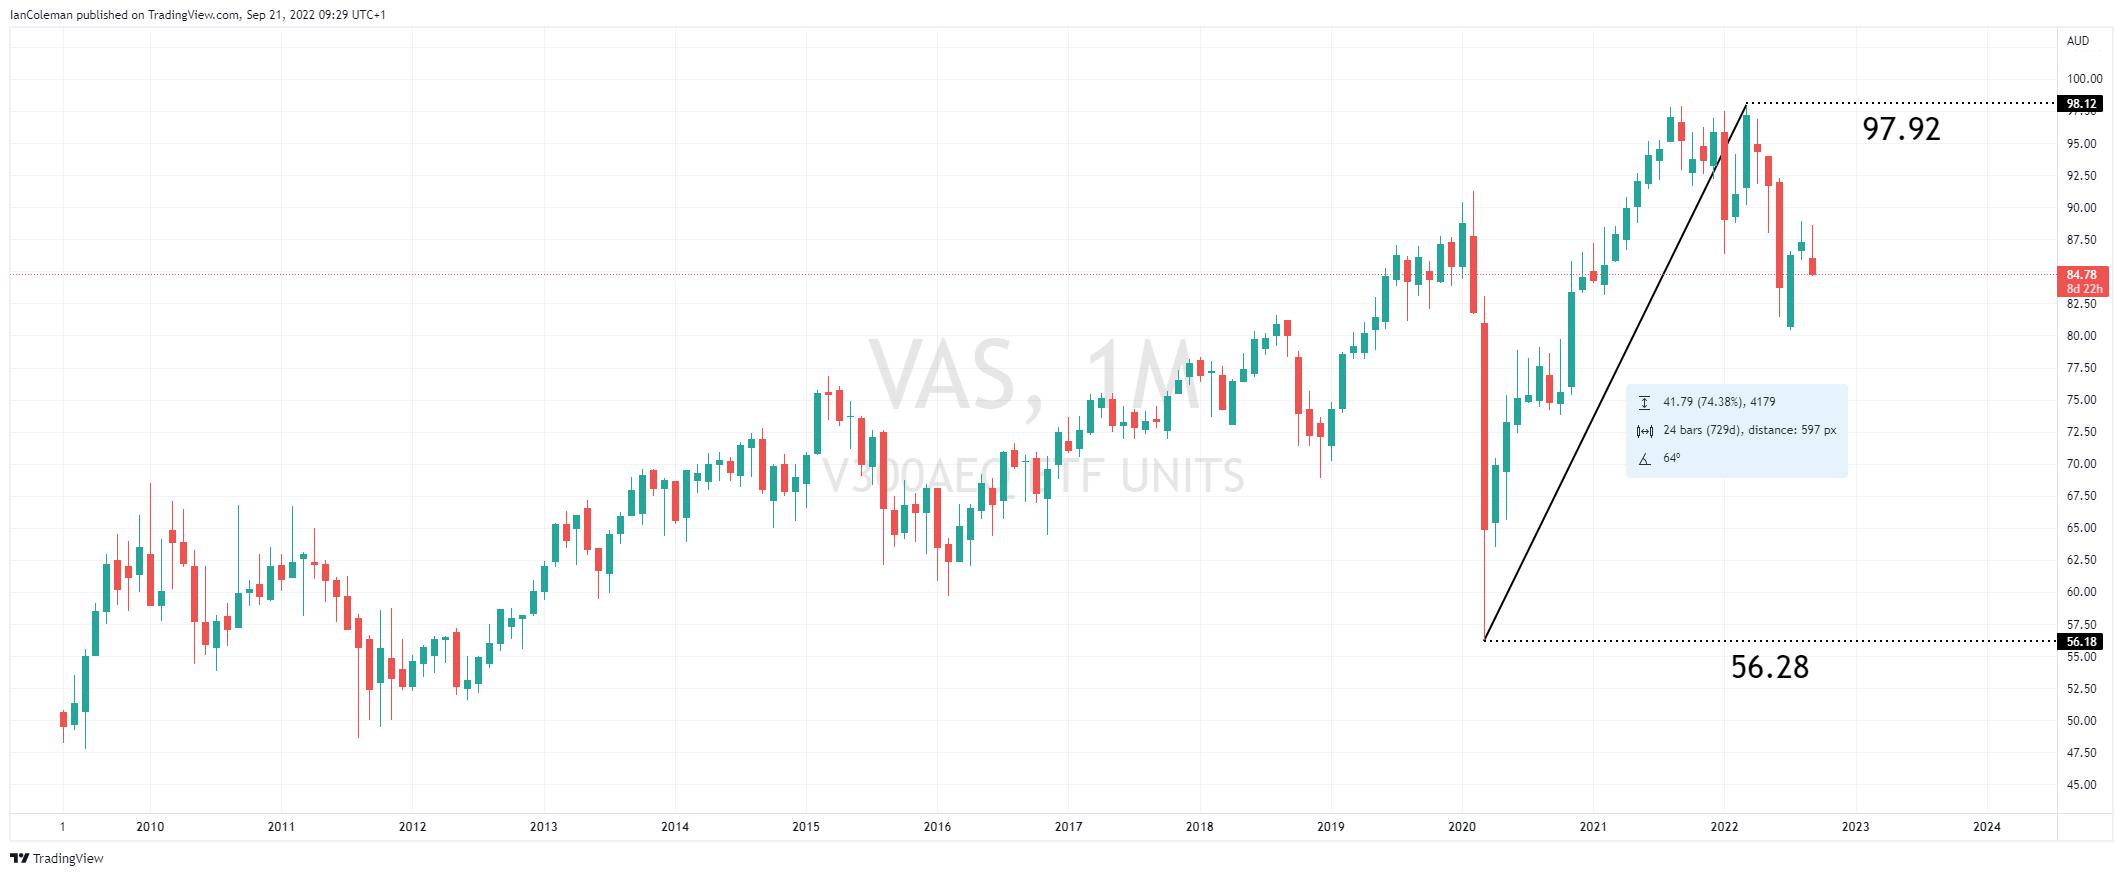
Launched in 2009, VAS ASX had a stellar performance from the 2020 lows of 56.28 to the high of 97.92 in March 2022. A rally of +74%.
Figure 1 Trading View VAS ASX 2020 rally
A look from a technical perspective
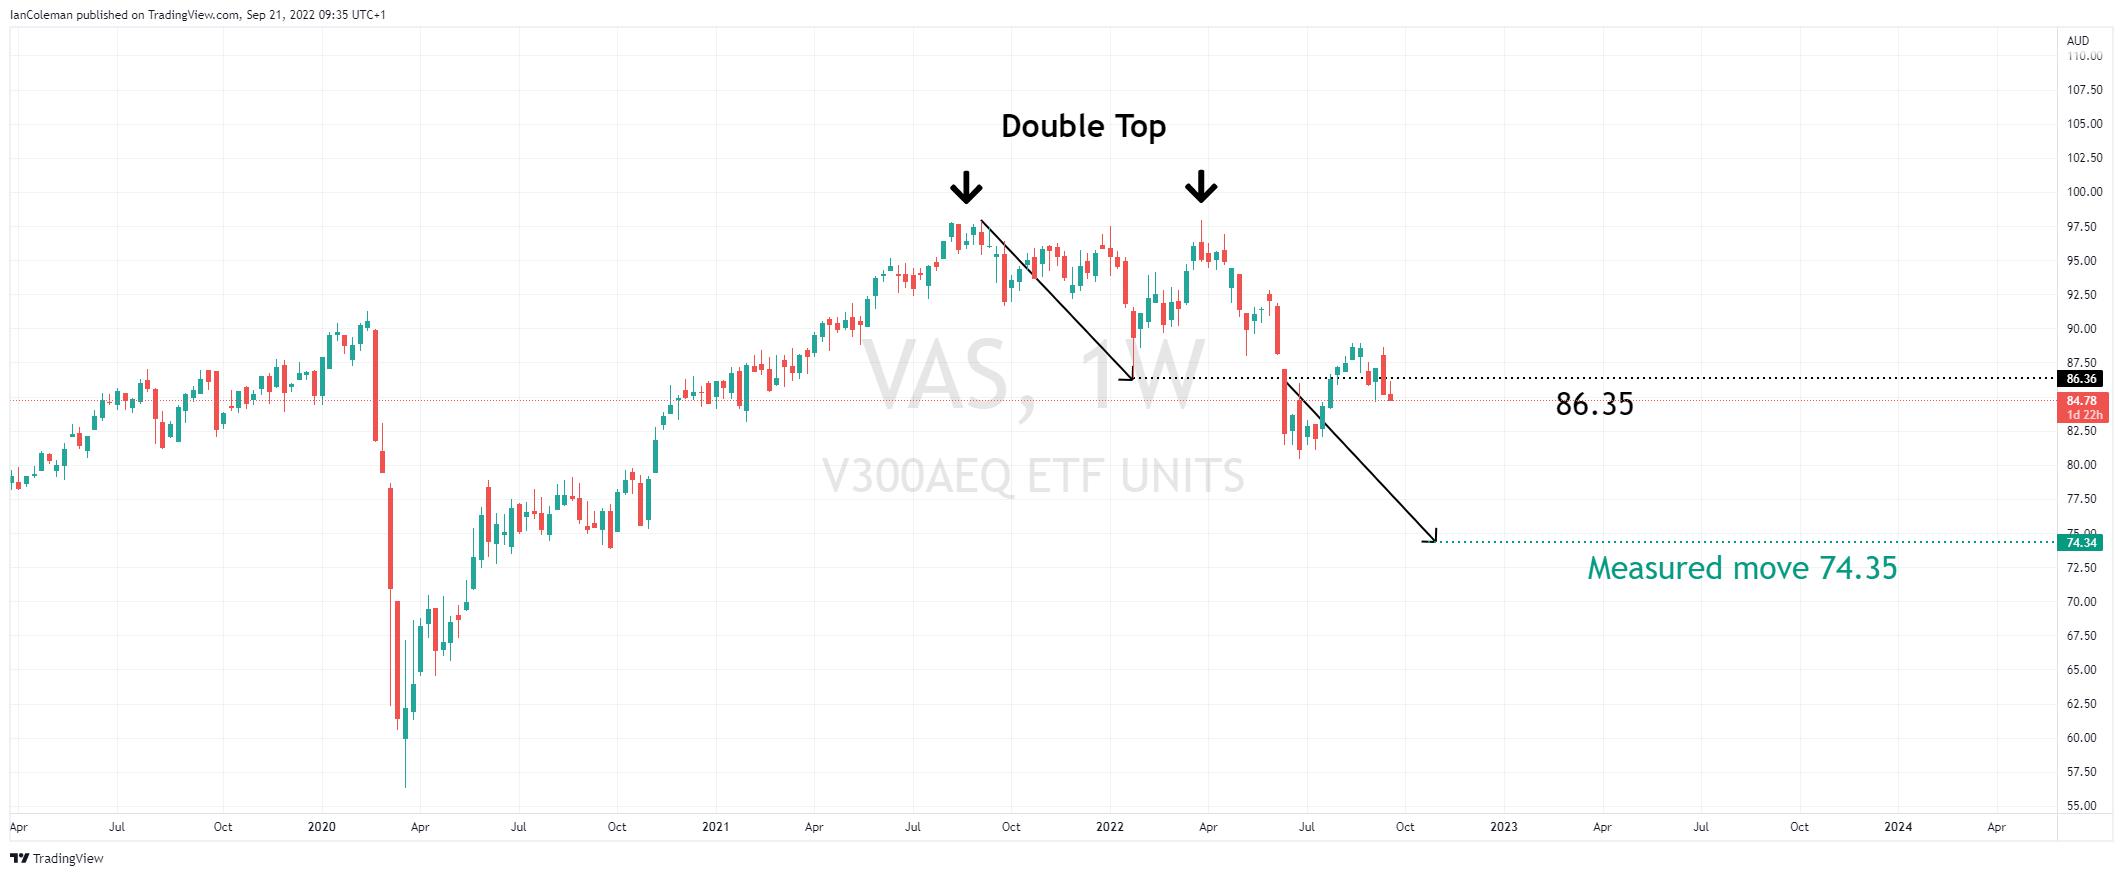
A look at the weekly chart from a technical perspective and the fund posted a double top formation. This was confirmed on a break of the swing low 86.35, the 24th of January base. The measured move target for the double top pattern is located at 74.35.
Figure 2 Trading View weekly VAS ASX double top
The move lower in mixed and volatile which is common in corrective formations.
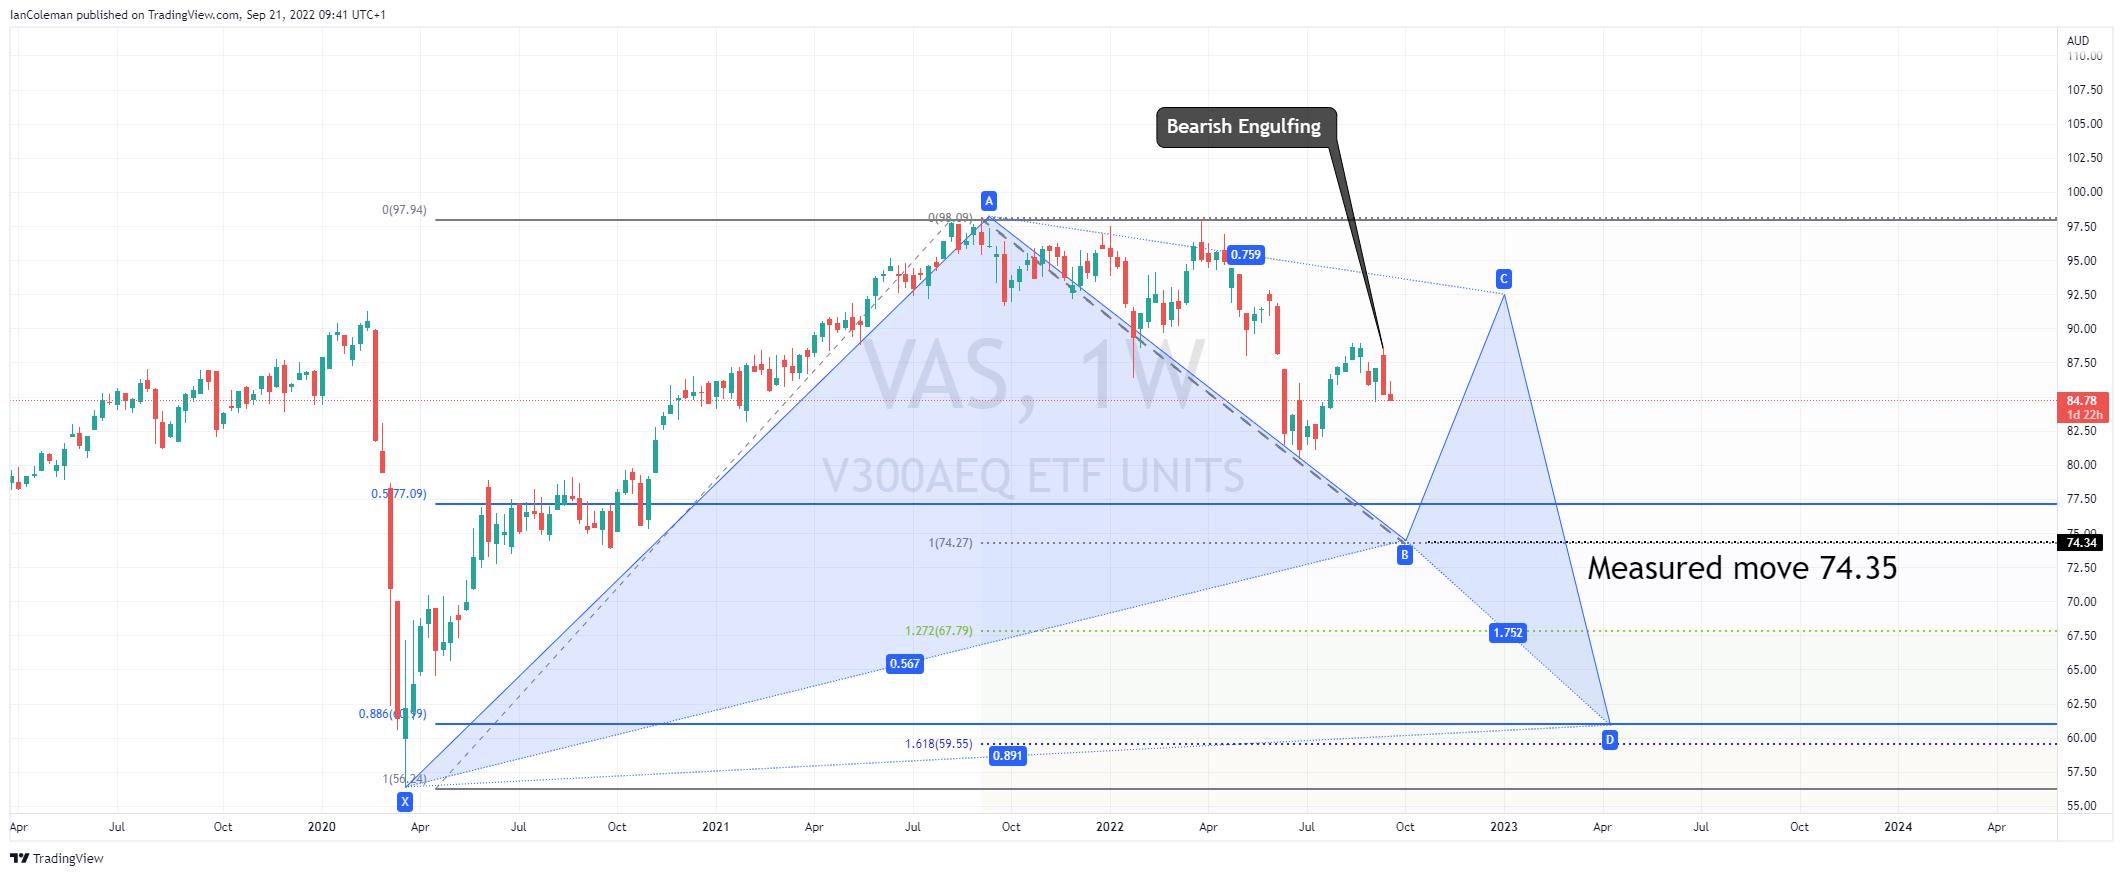
If we project our Fibonacci extension tool from the measured move target of 74.35, we get a confluence area at 60.99 and 59.78. This then potentially forms a bullish cypher pattern known as a Bat formation.
With last week’s strong selling producing a bearish Engulfing Candle (negative for sentiment) and with this week’s immediate rally being sold into, there is no clear indication of a change in the downward bias.
Figure 3 Trading View VAS ASX bearish engulfing
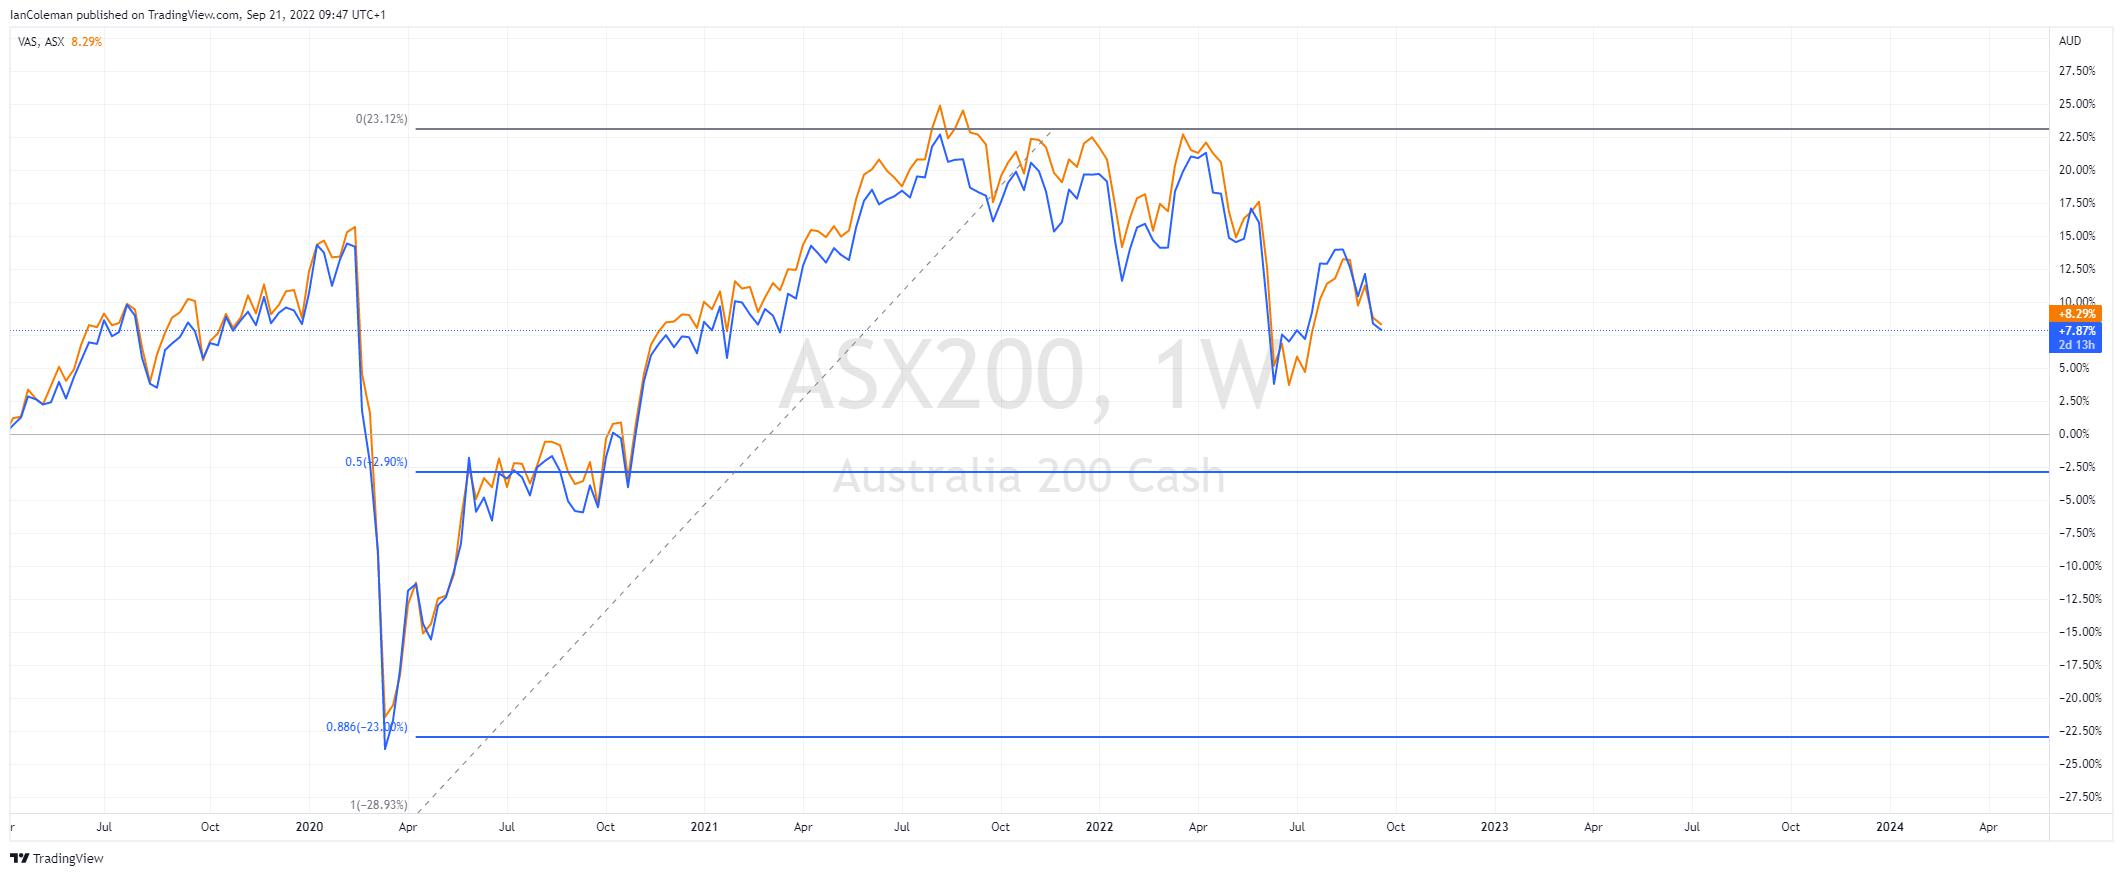
If we overlay the VAS ASX with the ASX200 we can clearly see a mirrored performance. With global inflation fears indices are moving lower and there is no clear indication of a change of direction…yet.
Figure 4 Trading View VAS ASX ASX200 overlay
It might be worth waiting on the side-lines until we reach the technical support level of 74.35 coupled with news that inflation is getting under control.
If you want to learn more about trading ETFs through Pepperstone, click here.
Related articles
لا تُمثل Pepperstone أن المواد المقدمة هنا دقيقة أو حديثة أو كاملة، وبالتالي لا ينبغي الاعتماد عليها على هذا النحو. البيانات، سواء كانت من جهة ثالثة أو غيرها، لا يجب اعتبارها توصية؛ أو عرض لشراء أو بيع؛ أو دعوة لعرض لشراء أو بيع أي أمان، منتج مالي أو صك؛ أو المشاركة في أي استراتيجية تداول معينة. لا تأخذ في الاعتبار الوضع المالي للقراء أو أهداف الاستثمار الخاصة بهم. ننصح أي قارئ لهذا المحتوى بطلب نصيحته الخاصة. بدون موافقة Pepperstone، لا يُسمح بإعادة إنتاج أو إعادة توزيع هذه المعلومات.


